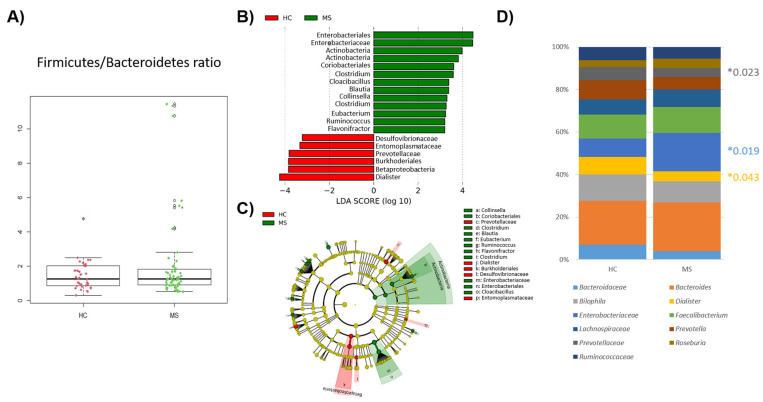
Figure 3.
Comparison of patients’ (MS) and controls’ (HC) bacterial microbiota. (A) Box plot showing the ratio of Firmicutes to Bacteroidetes between the HCs and MS. (B) Linear discriminant analysis (LDA) showing the differentially abundant bacterial groups as biomarkers determined using the Kruskal–Wallis test (p < 0.05) with an LDA score > 2.0. The plotted data represent the microbial differences between the MS patients (green) and healthy controls (red). (C) Cladogram plotted of the studied population’s microbiota. Cladograms show the different taxonomic levels by rings; the root of the cladogram denotes the domain bacteria, and phyla are represented in the inner ring and genus in the outer one. The plotted data represent the microbial differences between the MS patients (green) and healthy controls (red). (D) Bar plot of the top 10 genera in the HC and MS samples (note: where resolution at the genus level was not possible, taxa are described at the family level). Significant differences were indicated with *.

