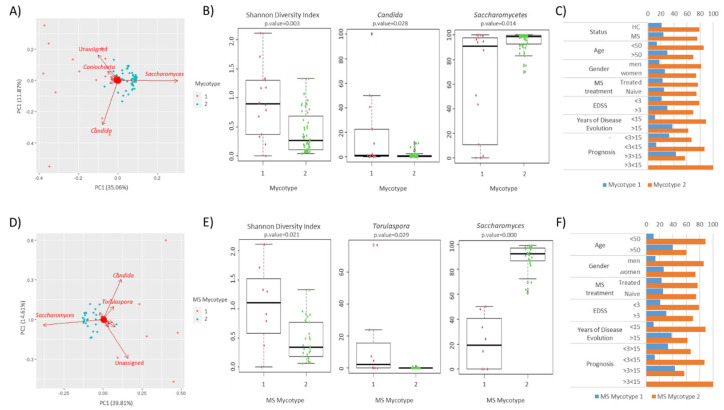
Figure 5.
Stratification of the studied population in mycotypes based on their gut mycobiome. (A) Scatter plot representing the mycotypes identified among the studied population. Clustered samples are represented in different colors, and the fungal groups that had a higher influence on the samples are represented by arrows. The bidimensional PCoA plot explains 46.9% of the sample’s variability. (B) The Shannon diversity index and fungal group abundance box plots showing the main contributors of each mycotype. (C) Influence of demographic and clinical factors on the gut fungal profile within each mycotype. (D) Scatter plot representing the MS mycotypes identified among the studied population. Clustered samples are represented in different colors, and the fungal groups that had a higher influence on the patient samples are represented by arrows. The bidimensional PCoA plot explains 26.9% of the sample’s variability. (E) The Shannon diversity index and fungal genus abundance box plots showing the main contributors to each MS mycotype. (F) Influence of demographic and clinical factors on the gut fungal profile within each MS mycotype.

