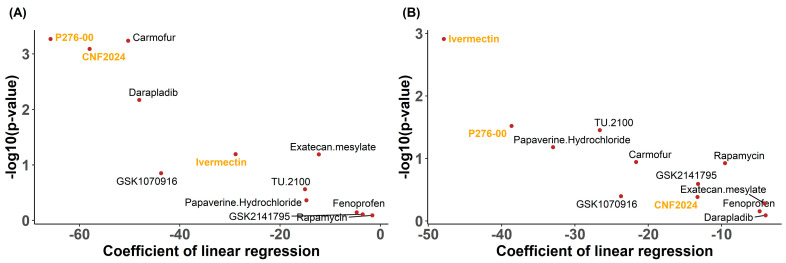
Figure 2.
Dot plots of coefficients for the final drug candidates in pan-cancer CCLs. (A) Coefficients of the linear regression between glycolysis score and measured drug response AUC. (B) Coefficients of the linear regression between OXPHOS score and measured drug response AUC. The statistical analysis was performed using Student’s t-test. Drug candidates for experimental validation are labeled orange.

