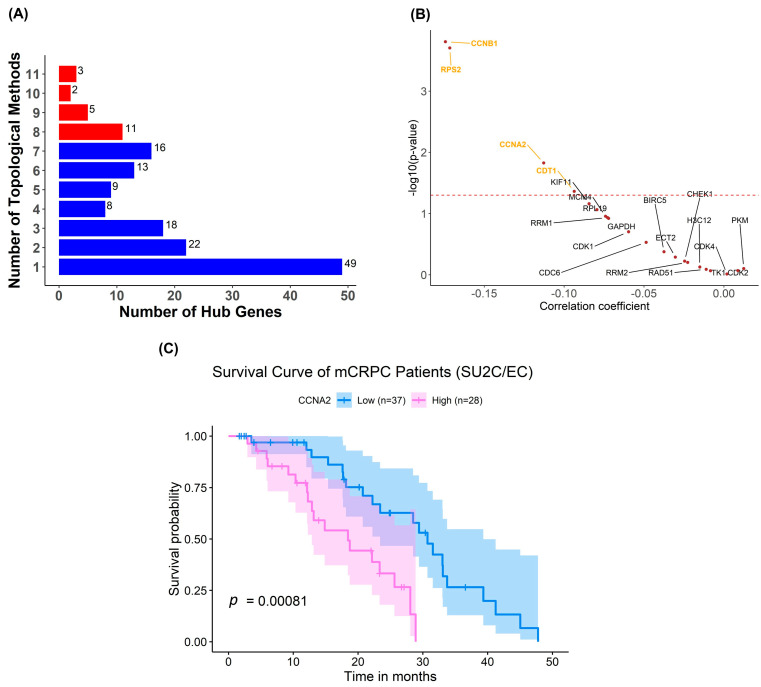
Figure 6.
Biomarker discovery for CNF2024. (A) Bar plot about a number of hub genes identified across 12 topological analyses. The red bars indicate the top four-tier consensus genes. (B) Spearman correlation analysis between gene expression and measured area under the drug-response curve (AUC) in pan-cancer CCLs. p = 0.05 (dashed red line). The statistical analysis was performed by Spearman rank correlation and Student’s t-test with a significance level of α = 0.05. (C) Survival analysis on patients stratified based on CCNA2 expression level in SU2C/EC clinical cohort. The statistical analysis was performed using the log-rank test with a significance level of α = 0.05. Abbreviations: SU2C/EC: Standard Up to Cancer East Coast.

