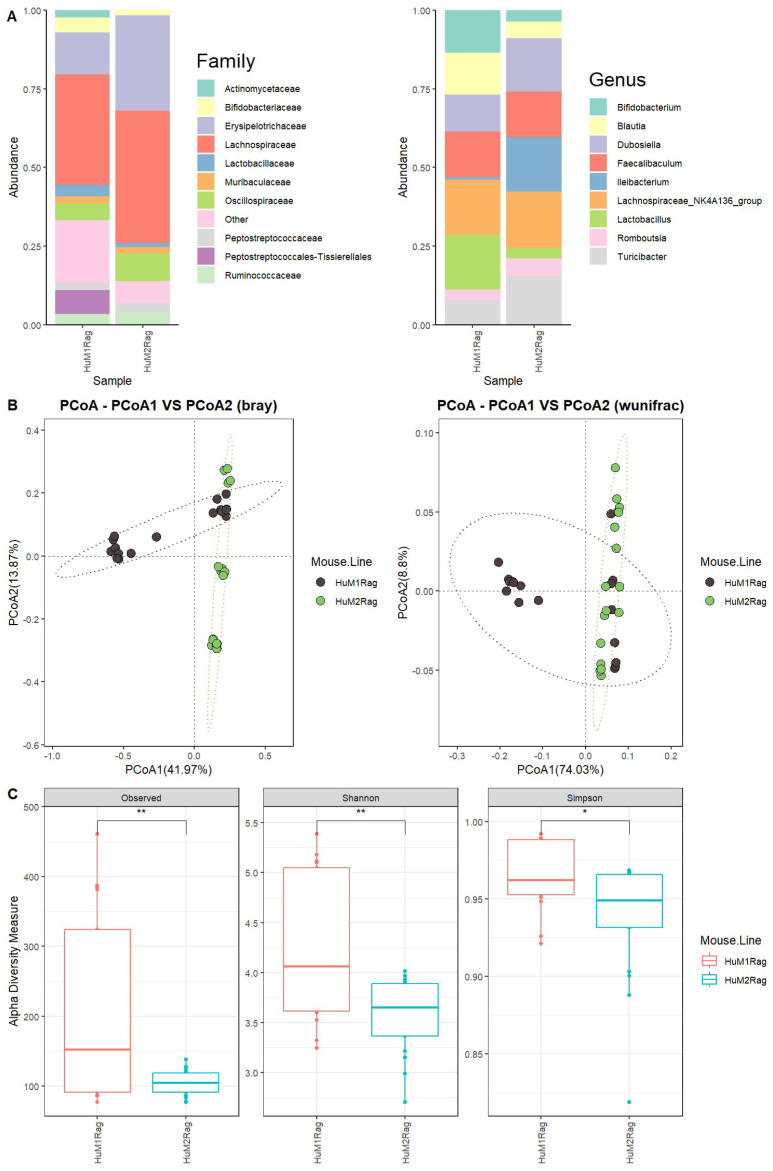
Figure 1.
HuM1Rag and HuM2Rag are unique microbiome lines. (A) The relative abundance of the top 10 taxa at the family level and Genus level across HuM1Rag and HuM2Rag pre-treatment. (B) Beta diversity was determined utilizing the Bray-Curtis and weighted UniFrac metrics for the pre–treatment groups. (C) Alpha-diversity measurements (observed ASVs, Shannon diversity index, and Simpson’s index) were obtained for the pre-treatment groups.

