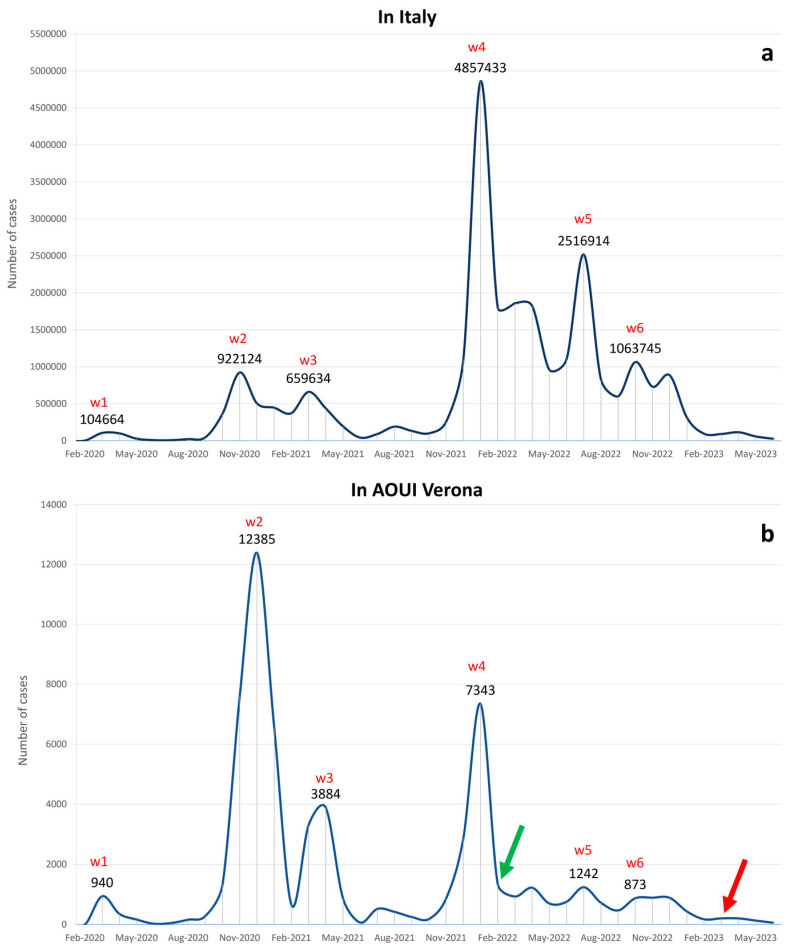
Figure 1.
The graph represents the number of positive cases per month from January 2020 to June 2023 in Italy (a) and at AOUI Verona (b). Peaks identified as epidemiological waves are labeled with the corresponding value. The green arrow on February 2022 indicates the beginning of sequencing screening at AOUI Verona. The red arrow in March 2023 indicates the end of SARS-CoV-2 mandatory surveillance for medical personnel at AOUI Verona. Waves are indicated in red as w1 (wave n° 1), w2 (wave n° 2), w3 (wave n° 3), w4 (wave n° 4), w5 (wave n° 5), and w6 (wave n° 6) above the corresponding peak in the panels (a,b).

