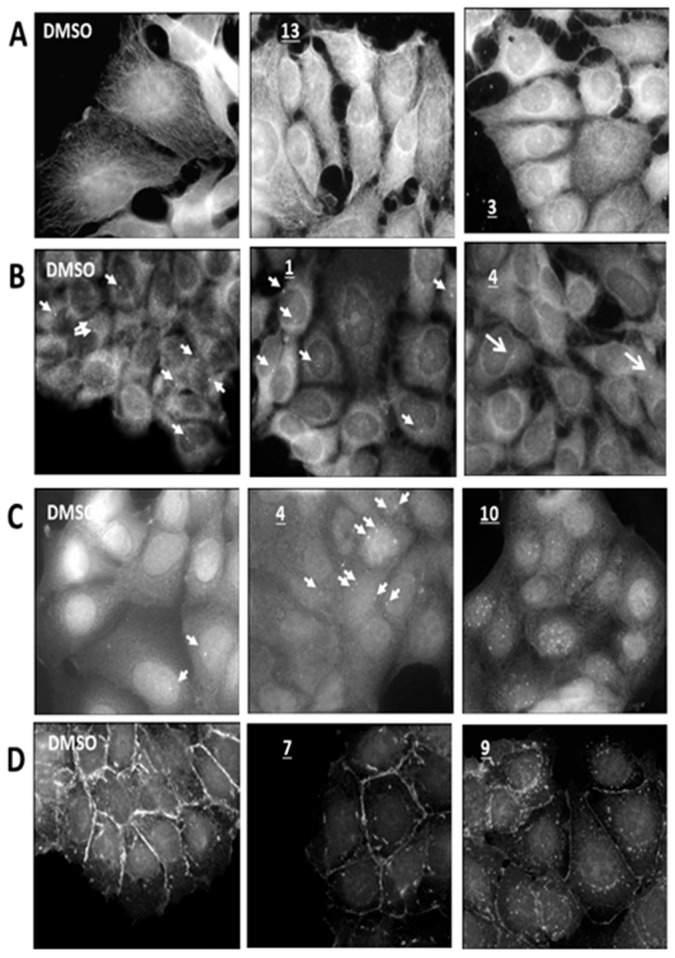
Figure 2.
Illustration of the effects on cellular substructures observed after incubation of the MCF7 cell line in RPMI, 10% FCS at 37 °C, 5% CO2 supplemented with DMSO 1% or plant extracts at 25 µg/mL. Only two pictures for each cell structure are presented and are representative of the feature observed. For each lane, the following are shown: left pictures—reference cells cultured in the presence of 1% DMSO; center pictures illustrate a ‘moderate effect’ on the structure, and right pictures show the strongest observed effect. Label of the compound referring to its identity is inserted in each panel. Lane A: Microtubular network, Lane B: centrosomal substructure localized by white arrows, Lane C: gH2AX-positive DNA double-strand breaks localized with white arrows except in the right panel where they are to numerous. Lane D: E-Cadherin assembly. For clarity, merged picture with DAPI nuclear staining is not presented.

