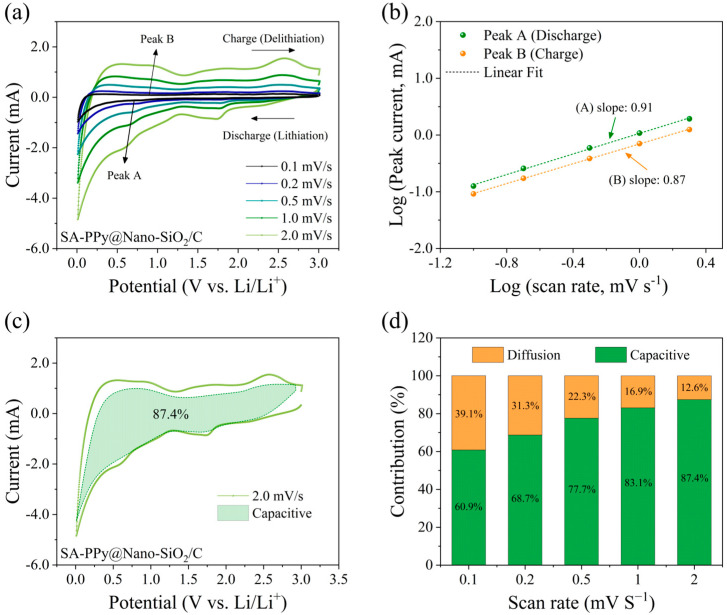
Figure 7.
Dynamic analysis of PPy@Nano-SiO2/C electrode in a half-cell configuration: (a) CV curves recorded at different scan rates; (b) b-value of a relationship between the log (sweep rate, mV s−1) and log (peak current, mA) in the discharge and charge processes (marked as peak A and peak B in (a)), (c) CV curves at the scan rate of 2.0 mV s−1 with capacitive-controlled (green region) contribution; and (d) variation of capacitive and diffusion contribution at different scan rates.

