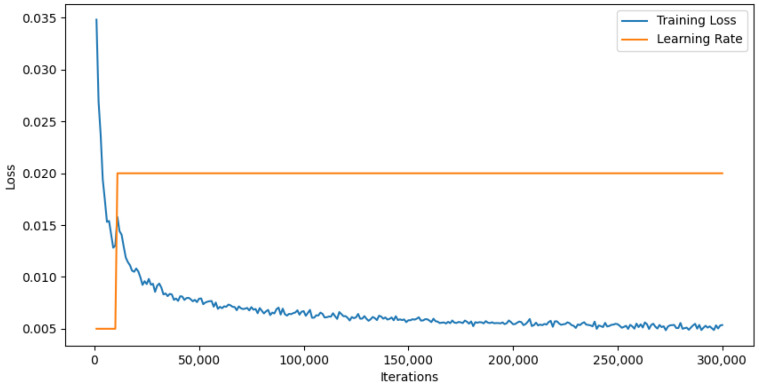
Figure 3.
Training loss and learning rate over iterations, illustrating the model’s learning process. The blue trajectory delineates the training loss, indicating a significant decrease as the iterations progressed, which demonstrated the model’s capacity to learn effectively. The orange line represents the learning rate, which remained constant throughout the training process.

