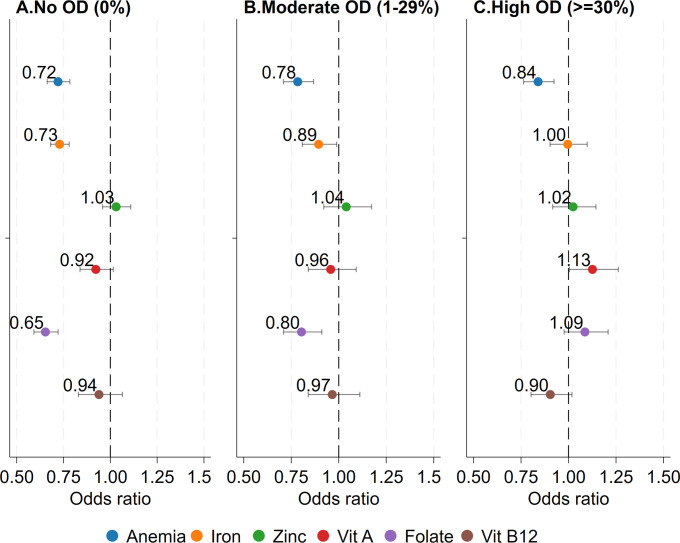
Fig 3. Odds of anemia or micronutrient deficiencies for dewormed vs. non-dewormed individuals by low, moderate, and high open defecation levels among Indians aged 1–19 years.
ORs are interpreted as the odds of being anemic or micronutrient deficient among children who were dewormed relative to those who were not. Logistic regression models are adjusted for sex, age, parental education, wealth, dietary patterns, and seasonality. Standard error estimates are clustered at the PSU level. OD was measured as the average proportion of sampled households practicing open defecation in a community, then was divided in 3 categories: OD free, moderate open defecation (1%–29% of households in a community practicing OD), high open defecation (30% to 100% of households in a community practicing OD). OD, open defecation; OR, odds ratio; PSU, primary sampling unit.

