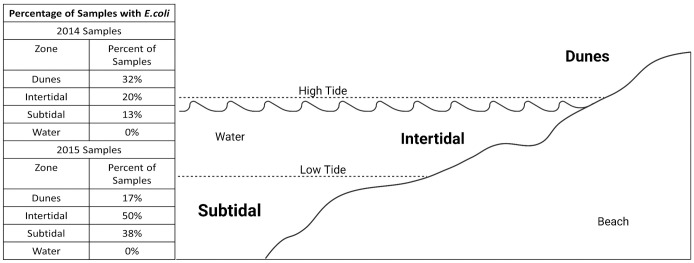
Fig 2. Beach zones and E. coli abundance.
Each sampling site has three zones: subtidal, intertidal, and dunes. These are determined by the height of the water surface during low and high tide. This figure shows a heuristic diagram of the zones of the beach. Sampling was conducted during low tide. Percentages represent the percentage of samples each year that tested positive for E. coli, regardless of whether the sample came from the beach’s renourished or non-renourished area. Created with biorender.com.

