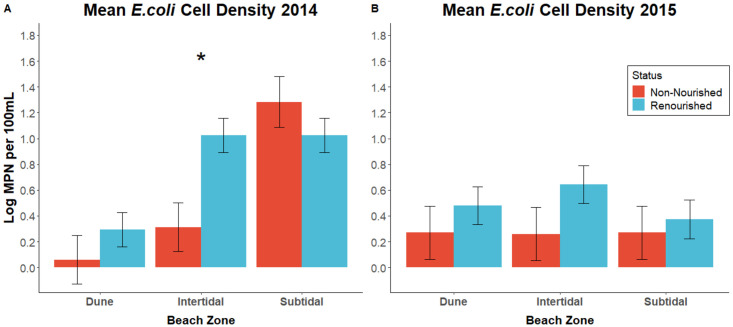
Fig 3. E. coli abundance across the beach.
Comparisons of E. coli abundance in 2014 and 2015 across each zone of the beach categorized by renourishment status. Statistically significant results are notated with an asterisk. * = P<0.05. Error bars represent the standard error of the group. A. In 2014, there was significantly more E. coli in the subtidal zones of the beach compared to the intertidal and dunes (t = 2.919, P = 0.0045; t = 5.884, P = < .0001). However, only the intertidal zones observed differences based on renourishment status. B. In 2015, the zone differences found in 2014 had dissipated, but there was generally more E. coli in the renourished sections of the beach when compared to the non-renourished sections, irrespective of zone (F = 4.137; P = 0.0408).

