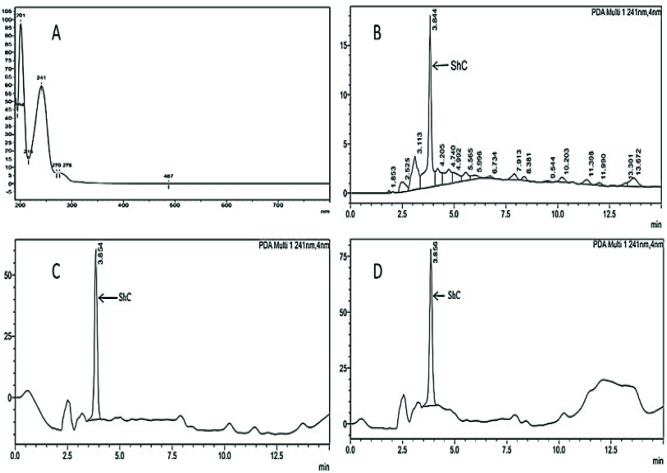
Fig 1.
UV-spectrum of S. heteromalla crude extract at wavelengths 201 and 241 nm in 190–800 nm UV range (A). HPLC chromatogram of S. heteromalla crude extract showing multiple detected compounds at different retention times (B). S. heteromalla crude extract (standard) chromatogram, (ShC) was selected as standard marker or base peak (C). S. heteromalla Crude extract sample (tablets) chromatogram (D).

