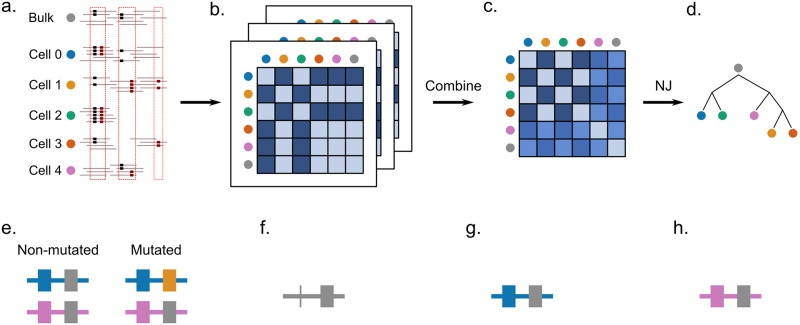
Fig 1. The workflow of Scuphr and the illustration of read-phasing.
a-d: The workflow of Scuphr. a: The sites are selected for analysis from bulk and single-cell DNA sequencing data. b: The distance matrix of each chosen site is calculated independently. c: The distance matrices are combined. d: The cell lineage tree is constructed from the final distance matrix using the NJ algorithm. e-h: Illustration of read-phasing. The first base pair is the gSNV locus and the second base pair is the candidate site. The gSNV nucleotides are shown in blue and pink colors. The reference and the mutation nucleotides are shown in gray and yellow, respectively. e: The non-mutated and mutated genomes are displayed. The mutation is associated with the blue allele (blue gSNV nucleotide). f: An example read covering both sites, but the gSNV information is disregarded as in many methods of SNV calling and tree reconstruction. The reference nucleotide is observed at the candidate site. The read might belong to either the non-mutated or the mutated genome. g: An example read with available gSNV site information. We can phase the read (identify which allele it originates from). The read must come from the blue allele; in this case, the read comes from the non-mutated genome. h: An example read with available gSNV site information. The read must come from the pink allele; in this case, the read might belong to either the non-mutated or mutated genome.

