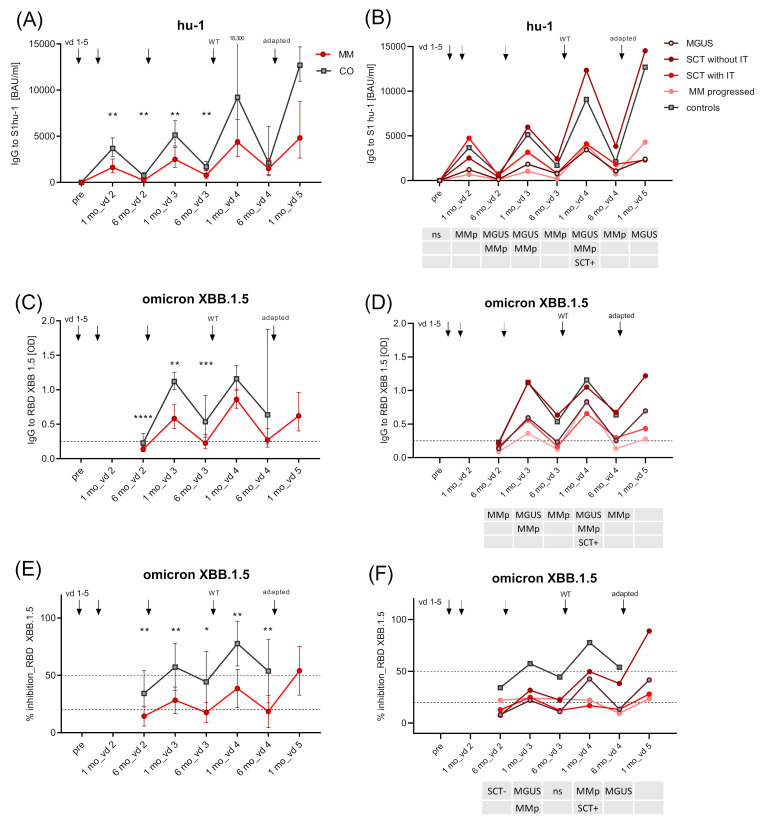
Figure 4.
Kinetics of SARS-CoV-2-specific IgG Ab levels (hu-1 and XBB.1.5) in entire MM group and MM subgroups. Kinetics of SARS-CoV-2 Wuhan S1-specific IgG (BAUs/mL) (A) for controls and entire MM group as GMC with 95% CI; (B) for controls and MM subgroups as GMC (95% CI provided in Supplementary Table S2A); kinetics of SARS-CoV-2 Omicron XBB.1.5 RBD-specific IgG (OD) for (C) controls and entire MM group as GMC with 95% CI; (D) for controls and MM subgroups as GMC (95% CI provided in Supplementary Table S2B); kinetics of SARS-CoV-2 Omicron XBB.1.5 RBD-binding (as % inhibition) for (E) controls and entire MM group as mean with 95% CI, and (F) for controls and MM subgroups as mean (95% CI provided in Supplementary Table S2C). MM subgroups: MGUS (dark red line), MM after SCT and no further immunomodulatory treatment (red line), MM after SCT with immunomodulatory treatment (light red line), progressed MM (pink line), and healthy controls (grey line) before vd1, one and six months after vd2, vd3, and vd4, and one month after vd5 of SARS-CoV-2 mRNA vaccine; for OD graphs: dashed black line—OD values >0.25 considered positive; for inhibition graphs: levels >20% considered positive (black dashed line), >50% relevant (red dashed line). Abbreviations: BAUs, binding antibody units; CI, confidence interval; GMC, geometric mean concentration; mo, months; OD, optical density; RBD, receptor-binding domain; S1, SARS-CoV-2 spike protein 1; SCT, stem cell transplant; SD, standard deviation; vd, vaccine dose. The table below the x-axis shows the subgroups that are significantly (p < 0.05) different from controls at the respective time point (linear contrast with Sidak–Holm-corrected p-values). p-values; **** p ≤ 0.0001; *** p ≤ 0.001; ** p ≤ 0.01; * p ≤ 0.05.

