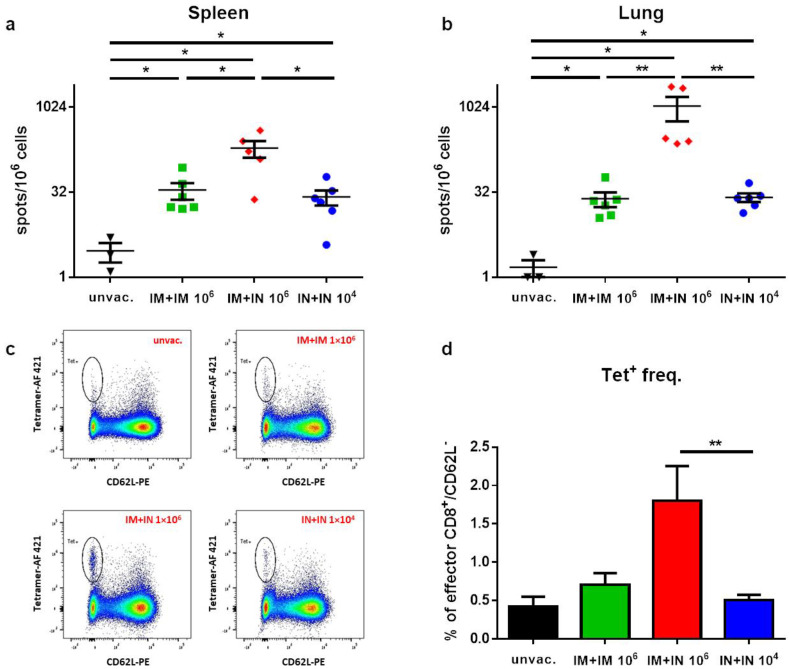
Figure 2.
Induction of CD8+ T-cell response following different vaccination regimens with VSV–ΔG–spike: Seven days post 2nd immunization, spike-specific T-cells in the (a) spleen and (b) lungs were enumerated by ELISpot assay. (c) Frequencies of spike-specific effector CD8+ T-cells in the lungs were determined by flow cytometry. A representative analysis from each group is shown. (d) Histograms incorporating the individual sets of results obtained for each animal. Tet+ stands for tetramer. Gating strategy for c appears in Supplementary Figure S3. Bars indicate means ± SEM from 3 to 6 animals per group. Statistical analysis was performed by Mann–Whitney nonparametric t-test. * p < 0.05; ** p < 0.01.

