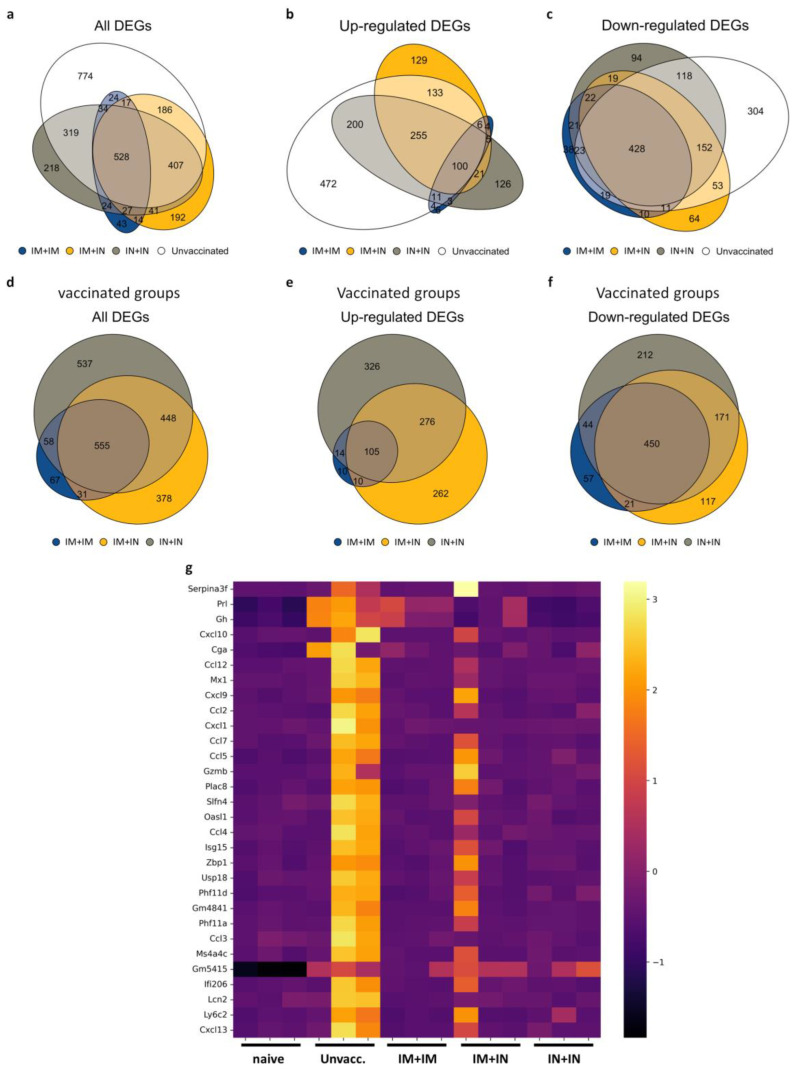
Figure 4.
Mucosal vaccination affects brain gene expression patterns following delta SARS-CoV-2 infection: (a–c) Area-proportional Venn diagrams of overlapping genes of unvaccinated, IM + IM-vaccinated, IM + IN-vaccinated and IN + IN-vaccinated mice brains at 4 days post-infection with the delta variant of SARS-CoV-2, showing (a) all DEGs, (b) upregulated DEGs and (c) downregulated DEGs. (d–f) Area-proportional Venn diagrams of overlapping genes in vaccinated groups, IM + IM, IM + IN and IN + IN mouse brains, at 4 days post-infection with the delta variant of SARS-CoV-2, showing (d) all vaccinated groups’ DEGs, (e) upregulated DEGs of vaccinated groups and (f) downregulated DEGs of vaccinated groups. n = 3 for each group. Log2 Fold Change (Log2FC) > 1 or <−1 for upregulated or downregulated DEGs, respectively. Each individual group is compared to naïve mouse brains prior to comparison to other groups. padj ≤ 0.05. (g) Heatmap of selected DEGs in all tested groups. Top 30 genes were selected based on the unvaccinated group’s Fold Change score. Scale represents z-score obtained on normalized reads. Adjusted p-value < 0.05.

