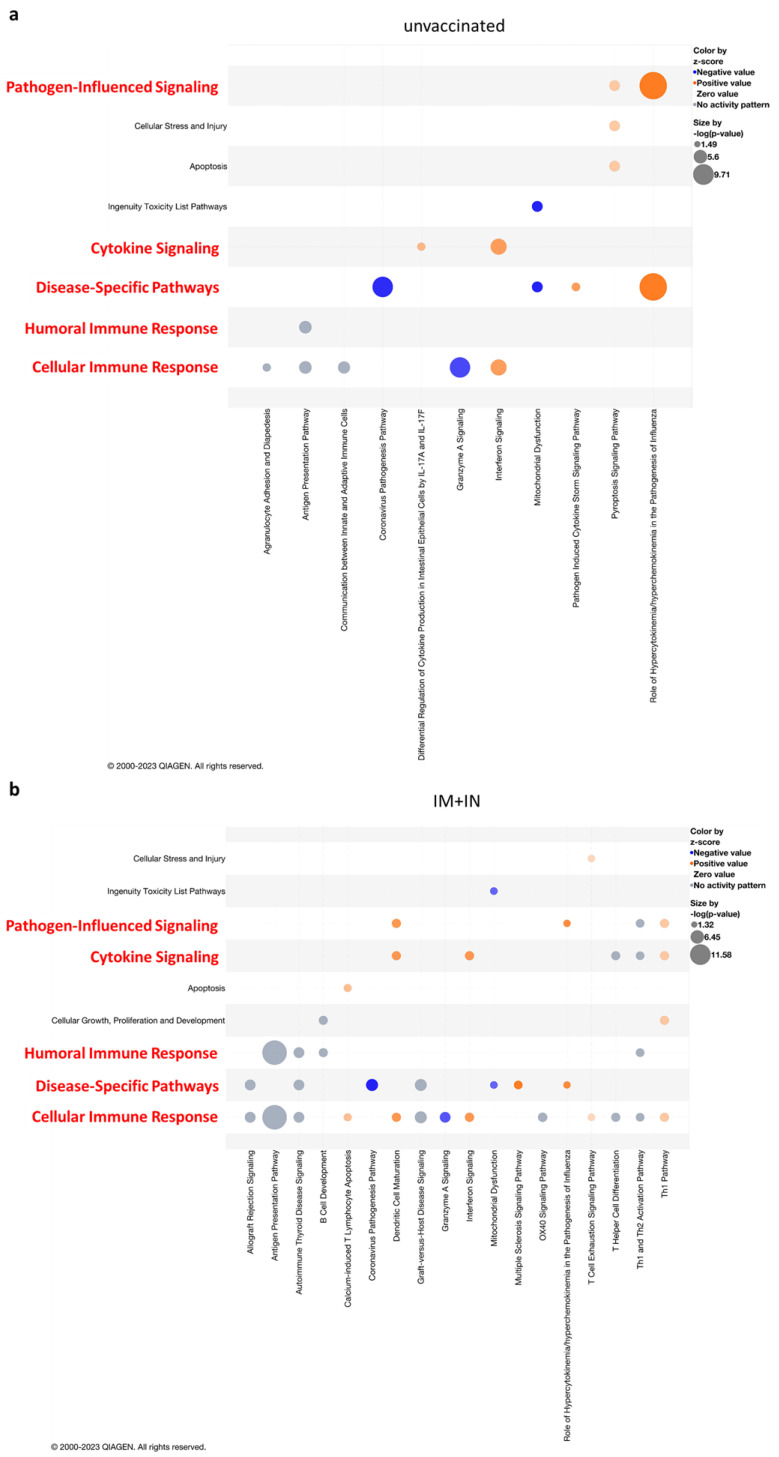
Figure 5.
Reduced enrichment of cellular and humoral immune responses, cytokine signaling and disease− and pathogen−influenced signaling by mucosal vaccination. Ingenuity-enriched pathway analysis bubble plots for each group: (a) unvaccinated group and (b) IM + IN-vaccinated K18–hACE2 mice’s brains at 4 days post-delta-variant SARS-CoV-2 infection. Each bubble plot shows enriched pathways arranged by categories of interest: cellular immune response, cytokine signaling, disease−specific pathways, humoral immune response and pathogen−influenced signaling (y-axis, highlighted in red), and the enriched canonical pathways that map to each category (x-axis), arranged in an alphabetical order. Color by z-score: orange indicates pathway activation, blue indicates pathway inhibition and grey represents no activity pattern, as predicted by Ingenuity knowledge. Bubble size represents -log (p-value). Legend appears on the upper right side of each panel. Pathway enrichment was set to a cutoff of <0.05. n = 3 for each group. Right-tailed Fisher’s exact test. A Benjamini–Hochberg multiple-comparisons correction test was applied.

