
Figure 6.
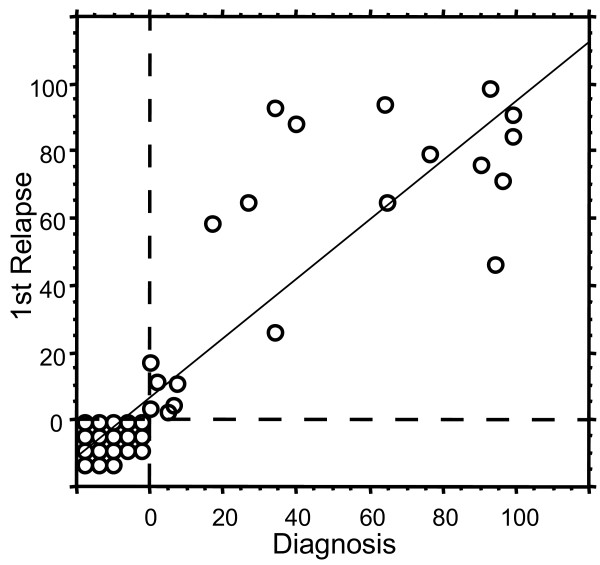
Stability of CD66c from diagnosis to relapse. Each circle represents one patient (n = 39). Percentage of CD66cpos blasts at diagnosis is plotted against percentage of CD66cpos blasts at relapse. Regression line with 95% confidence R2 = 0.755