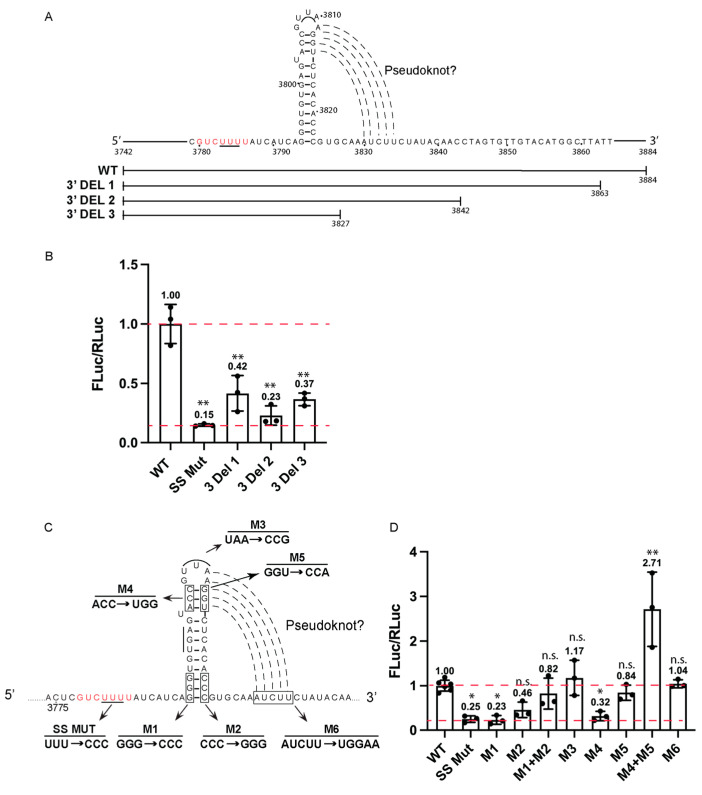
Figure 2.
Structural analysis of BaDV-2 -1 FS element. (A) Schematic of deletion mutants surrounding the putative BaDV-2 -1 FS. The slippery sequence is shown in red letters. (B) In vitro transcribed RNAs were incubated in RRL and luciferase activities were measured and normalized to wild-type BaDV-2 -1 FS (BaDV-2 FS WT). Groups were compared to the wild-type BaDV-2 -1 FS. (C) Schematic view of BaDV-2 -1 FS mutations. (D) In vitro transcribed RNAs were incubated in RRL, and luciferase activities were measured and normalized to wild-type BaDV-2 -1 FSS (BaDV-2 WT). The top red dotted line represents Fluc/RLuc ratio of the wild-type -1 FS activity normalized to 1. The lower red dot line represents the background characterized by a mutation in the slippery site (SS MUT, UUU3783-5CCC) that abolishes -1 FS activity. Groups were compared to BaDV-2 WT. A one-way ANOVA statistical test was used to determine the p values (* p < 0.05, ** p < 0.01). “n.s.” denotes the difference is not significant between the experimental groups and WT (p > 0.05). Shown are averages from at least three independent experiments ± standard deviation.

