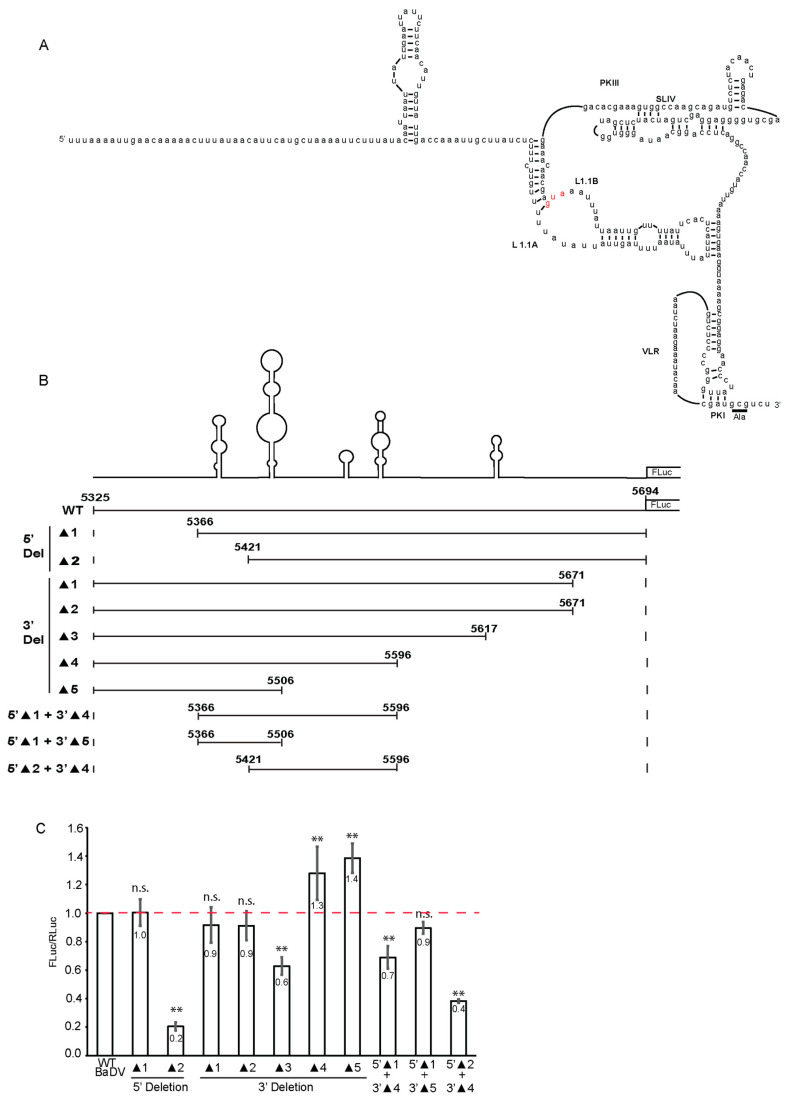
Figure 4.
Deletion analysis of BaDV-2 IGR IRES. (A) Schematic of the initial predicted structure of the BaDV-2 IGR IRES. The red AUG denotes the predicted start codon. (B) 5′ and 3′ deletions were generated within the BaDV-2 IGR. “▲” = DEL = deletion. (C) Bicistronic RNAs containing the corresponding deletion mutants were incubated in Sf-21 extracts and RLuc and FLuc activities measured and normalized to the wild-type BaDV-2 IRES. The red line denotes the FLuc:RLuc ratio of the wild type IRES for comparison. A one-way ANOVA statistical test was used to determine the p value and thus the significance levels. Groups were compared to WT BaDV. ** p < 0.01. “n.s.” denotes the difference is not significant between the experimental groups and WT (p > 0.05). Shown are the averages from at least three independent experiments ± standard deviation.

