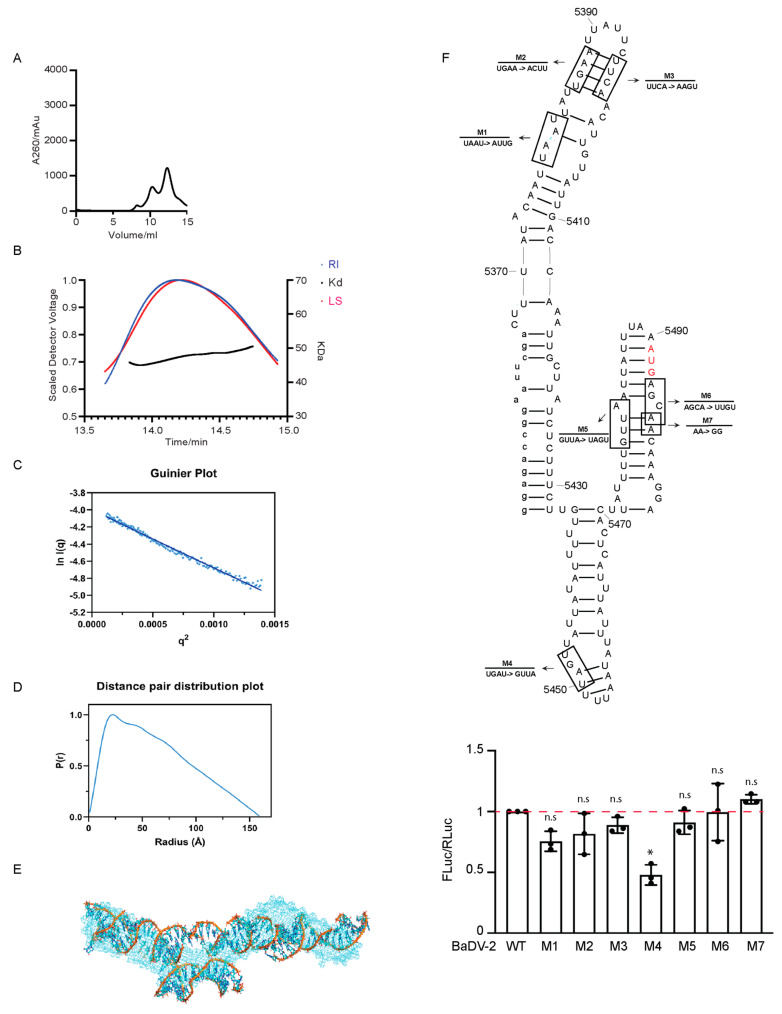
Figure 5.
Structural analysis of BaDV-2 IGR IRES. (A) FPLC profiles associated with BaDV-2 IGR “minimal” IRES IVT RNA purification. (B) SEC-MALS traces of the peak from the BaDV-2 IRES RNA run and the absolute molecular weight across them. (C) The absence of aggregation and the presence of a liner Guinier region in the sample indicates its purity, which enables the calculation of Rg from the low-angle region data and signifies the homogeneity of the sample. (D) Normalized pair distance distribution plots for BaDV-2 IRES RNA permit the determination of Rg derived from the SAXS dataset and including each molecule’s Dmax. P(r) versus radial distance plot indicates an elongated RNA structure in solution. (E) Predicted BaDV-2 IRES RNA structure model from SAXS data (light blue) overlapped with atomistic structure, represented in ribbons. (F) The secondary structural model of BaDV-2 IRES corresponding to the predicted model as shown in (E). The red letters denote the predicted AUG start codon. Mutation analysis of BaDV-2 “minimal” IRES with bicistronic reporter Sf-21 translation assays were performed and the results (M1-7) were measured by luciferase assays and normalized to wild-type (WT) BaDV-2 IGR IRES “minimal” IRES (bottom). Groups were compared to WT BaDV-2 IRES (red dotted line). An ANOVA statistical test was used to determine the p value and thus the significance levels. * p < 0.05. “n.s.” denotes the difference is not significant between the experimental groups and WT (p > 0.05). Shown are the averages from at least three independent experiments ± standard deviation.

