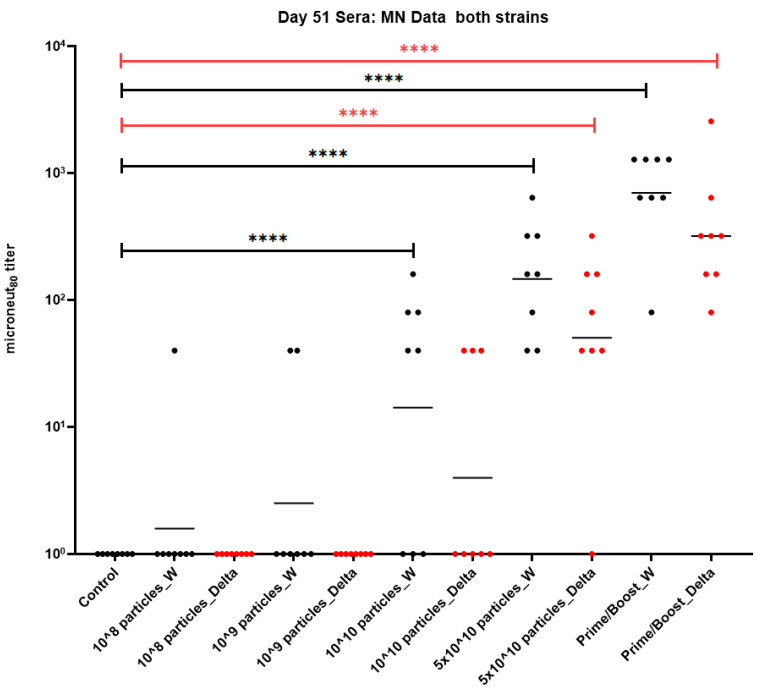
Figure 3.
MN80 data (day 51 sera) from nonhuman primates vaccinated with SARS-CoV-2 PsIV. Data (average of duplicate results) for individual animals are represented by circles, and the geometric mean titer for each group is represented by a horizontal bar. Statistical significance between groups is denoted by **** p ≤ 0.0001.

