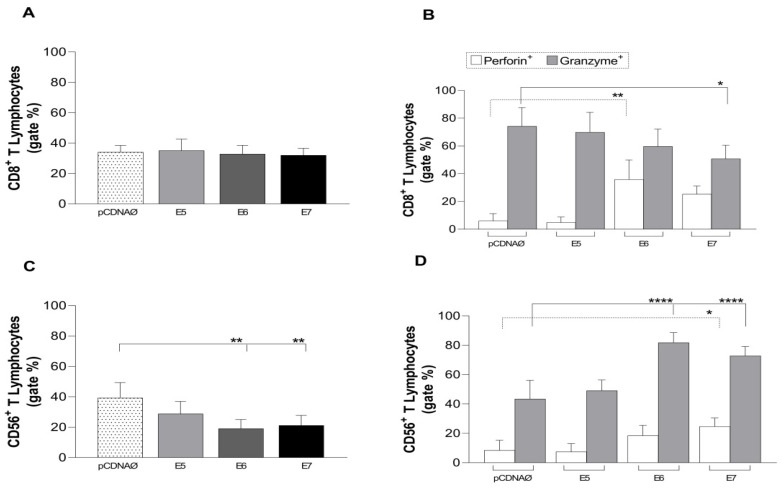
Figure 4.
Stimulation profile of CD8+ and CD56+ T lymphocytes cultured with the MDA-MB 231 tumor line. Experimental groups: the empty pcDNA vector and lymphocytes cultured with transfected MDA-MB 231 with the E5, E6, and E7 genes. (A)—Differential count of CD8+ T lymphocytes. (B)—Intracellular production of perforin and granzyme in CD8+ T lymphocytes. (C)—CD56+ T lymphocyte differential count. (D)—Intracellular production of perforin and granzyme in CD56+ T lymphocytes. Asterisks represent statistical significance (* p < 0.05, ** p < 0.001, **** p < 0.0001). Error bars: standard error between samples.

