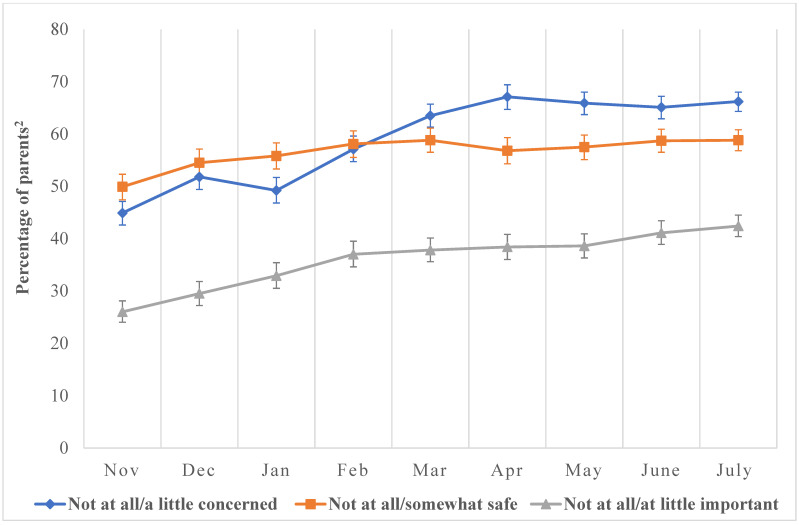
Figure 2.
Prevalence of perceptions towards pediatric COVID-19 vaccines as reported by parents of children ages 5–11 years, November 2021–July 2022, National Immunization Survey. The denominator of the percentages on the y-axis represents all completed parent interviews for children aged 5–11-years collated monthly between November 2021 and July 2022. The numerator represents parents reporting the level of sentiments and perceptions indicated in the graph (e.g., those whose parents reported that COVID-19 vaccines were not at all or somewhat safe, not at all or a little important, etc.). (a) Not at all concerned/a little: We assessed parents’ concern for pediatric COVID-19 infections with, “How concerned are you about your child getting COVID-19?” Responses were not at all concerned, a little concerned, moderately concerned, and very concerned. Responses were dichotomized into two categories: Not at all concerned and a little concerned. (b) Not at all/somewhat safe: We assessed parents’ perceptions about COVID-19 vaccine safety with, “How safe do you think COVID-19 vaccine is for child?” Responses were not at all safe, somewhat safe, very safe, and completely safe. Responses were dichotomized into two categories: Not at all safe and somewhat safe. (c) Not at all important/a little important: We assessed parents’ perception of COVID-19 vaccine importance by asking, “How important do you think getting a COVID-19 vaccine is to protect child against COVID-19?” Responses were not at all important, a little important, somewhat important, and very important. Responses were dichotomized into two categories: Not at all important and a little important. 2 The data obtained from the NIS-CCM are weighted to be representative of children in the US. Accordingly, our results reflect the “percentage of children with a parent who has reported hesitancy either towards pediatric COVID-19 vaccines or RCI”. However, to make interpretation easier, we have simplified this as “percentage of parents” on the y-axis.

