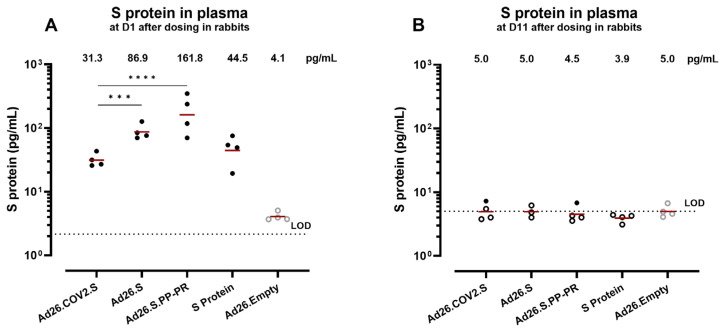
Figure 3.
Concentration of S protein in plasma after administration of S protein or Ad26-based vectors encoding the S protein in rabbits. Plasma from rabbits (n = 4 per group/timepoint) dosed with Ad26.COV2.S, Ad26.S, Ad26.S.PP-PR, recombinant S protein COR201225 + aluminum hydroxide (Al(OH)3), or Ad26.Empty was analyzed at (A) Day 1 and (B) Day 11 after dosing. Symbols in (A) represent the mean response per animal of 2 independent assays. A comparison of the S-protein concentration induced by Ad26.COV2.S and Ad26.S or Ad26.S.PP-PR was performed using a Tobit model with a Bonferroni adjustment for multiple comparisons, *** p = 0.0006, **** p < 0.0001. The dotted line represents the lower limit of detection (LOD) of the assay based on the standard curve. The background is defined by responses measured after dosing with Ad26.Empty, which does not include or encode SARS-CoV-2 S. Open symbols represent values below the 95th percentile of the Ad26.Empty group. The geometric mean is represented with a red line.

