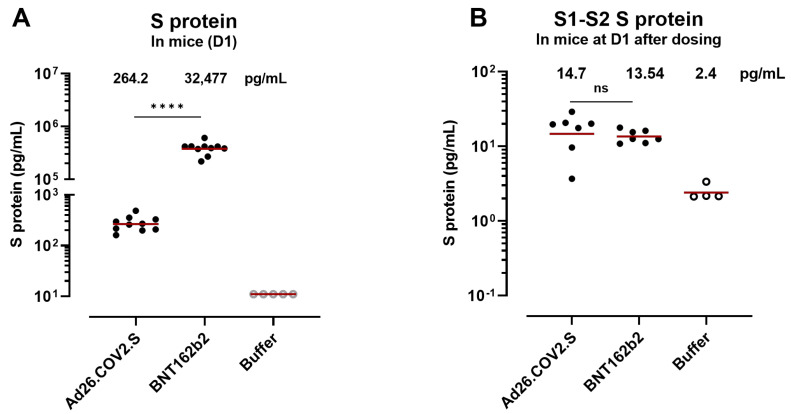
Figure 4.
S-protein concentration in mouse serum after Ad26.COV2.S or S-encoding mRNA vaccination. (A) S protein was measured in mouse serum at 24 h after dosing with Ad26.COV2.S or BNT162b2. Open symbols represent values below the 95th percentile of the buffer (negative control) samples. (B) S1–S2 protein was measured at 24 h after dosing in serum. Comparisons of the S protein concentration and the S1–S2 concentration were performed using a non-parametric t-test (Mann–Whitney test), **** p < 0.0001, ns, not significant. The geometric mean is represented with a red line.

