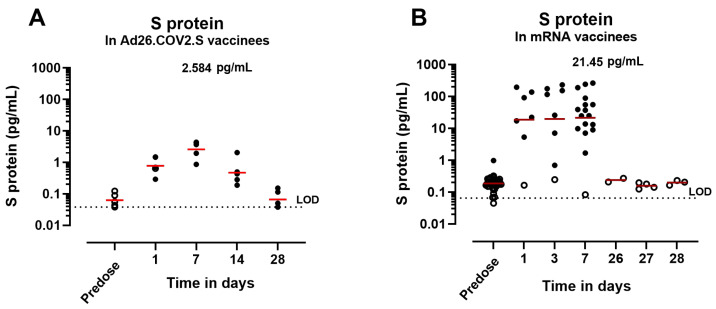
Figure 5.
S-protein concentration in human serum after Ad26.COV2.S or S-encoding mRNA vaccination. S-protein expression kinetics in serum from (A) five Ad26.COV2.S vaccinees or (B) from mRNA vaccinees at different timepoints. Open symbols represent values below the 95th percentile of the predose samples. The geometric mean is represented with a red line and, at Day 7 after dosing, is represented in pg/mL. The dotted lines represent the lower limit of detection (LOD) of the assay based on the standard curve.

