Figure 7.
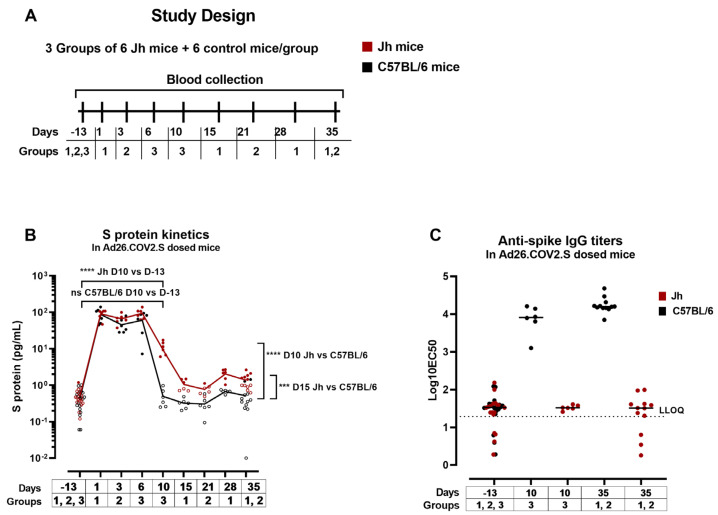
S-protein expression and S-specific IgG titers in antibody-deficient and wild-type mice. (A) Antibody-deficient mice (Jh) or control mice (C57BL/6) were dosed with 5 × 10⁹ vp/mouse of Ad26.COV2.S (Groups 1–3). (B) Expression of S protein was measured in serum at different timepoints. The open symbols represent the values below the 95th percentile of the predose values. The red (Jh mice) and black (control mice) lines represent the trend of the mean S-protein expression across timepoints. *** p < 0.001, **** p < 0.0001. (C) S-specific IgG titers were measured in serum from predose sampling, 10 days and 35 days after dosing in 2 enzyme-linked immunosorbent assay (ELISA) runs. The dotted line represents the lower limit of quantification (LLOQ) of the assay. Each symbol (circles, squares, and triangles) corresponds to a different group of mice. Statistical comparisons were performed using paired t-tests or unpaired t-tests when comparing different mice.

