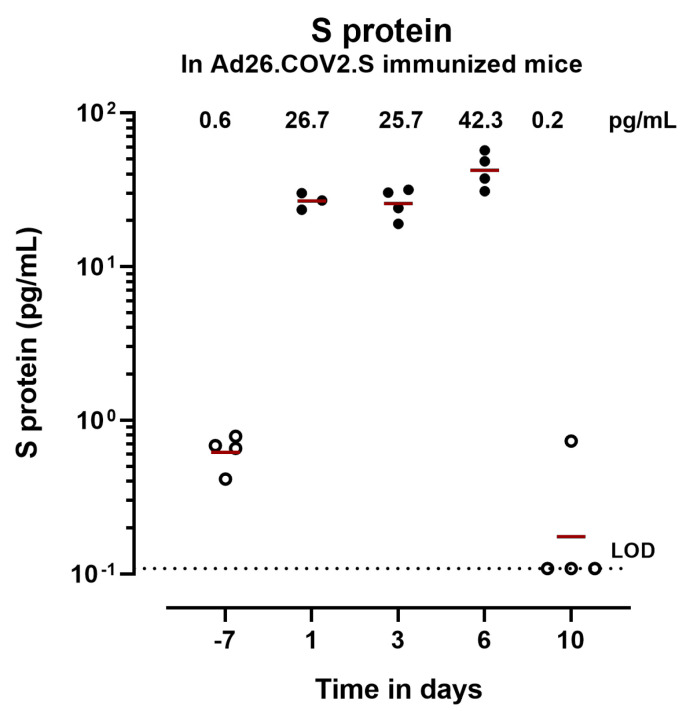
Figure A4.
S protein concentration in serum of mice dosed with Ad26.COV2.S. BALB/c mice (4 mice/group, 1 group/timepoint) were dosed with 1 × 10⁹ vp/mouse and S protein was measured in serum at different timepoints (1 symbol/mouse). The dotted line represents the lower LOD of the assay based on the standard curve. Open symbols represent values below the 95th percentile of the predose samples. The geometric mean is represented with a red line.

