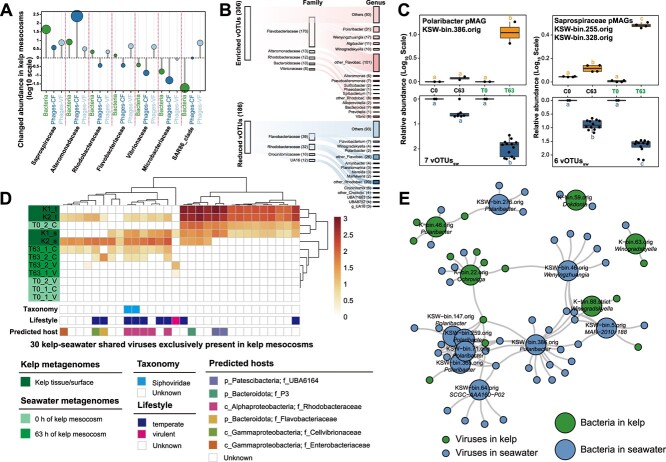
Figure 3.
Dynamics of phage-bacterium interactions in the kelp mesocosm experiment. (A) Changes in the relative abundance of bacteria and their predicted phages among different bacterial families in kelp mesocosms. (B) Sanky plot showing the predicted phage-bacteria associations among the significantly differentially abundant phages (vOTUs, left) in response to kelp cultivation. The middle and right bars represent the number of pairings in each bacterial family and genus, respectively. (C) Changes in the relative abundance of a Polaribacter bacterium and two Saprospiraceae bacteria and their predicted phages in cell-enriched fractions. Different letters indicate significantly different groups (P < .05, ANOVA, Tukey HSD). (D) Heatmap showing the kelp-seawater shared viruses exclusively present in kelp mesocosms. Control and kelp-inoculated groups are denoted as “C” and “T” respectively. (E) Interaction network of Flavobacteriaceae bacteria (large circles) and phages (small circles) identified from kelp and seawater.

