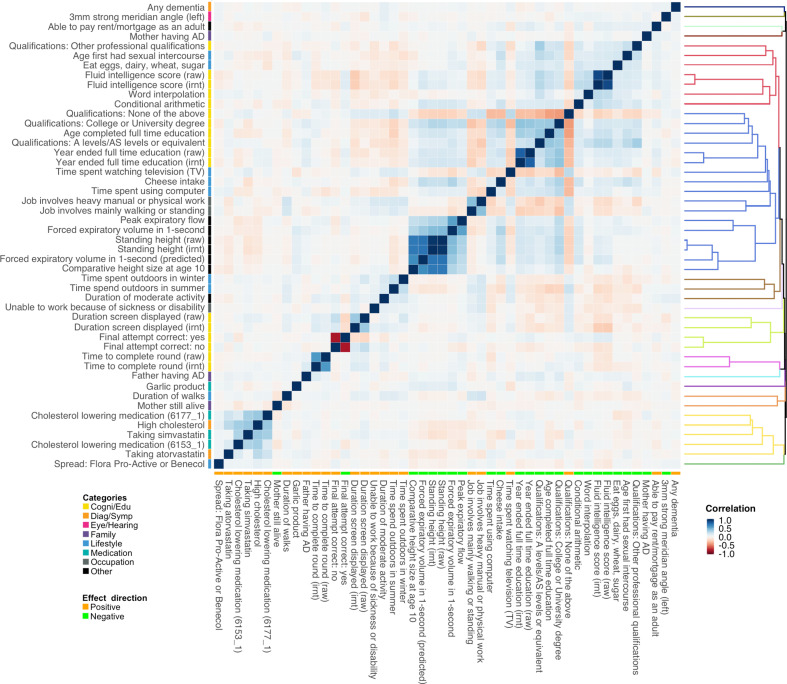
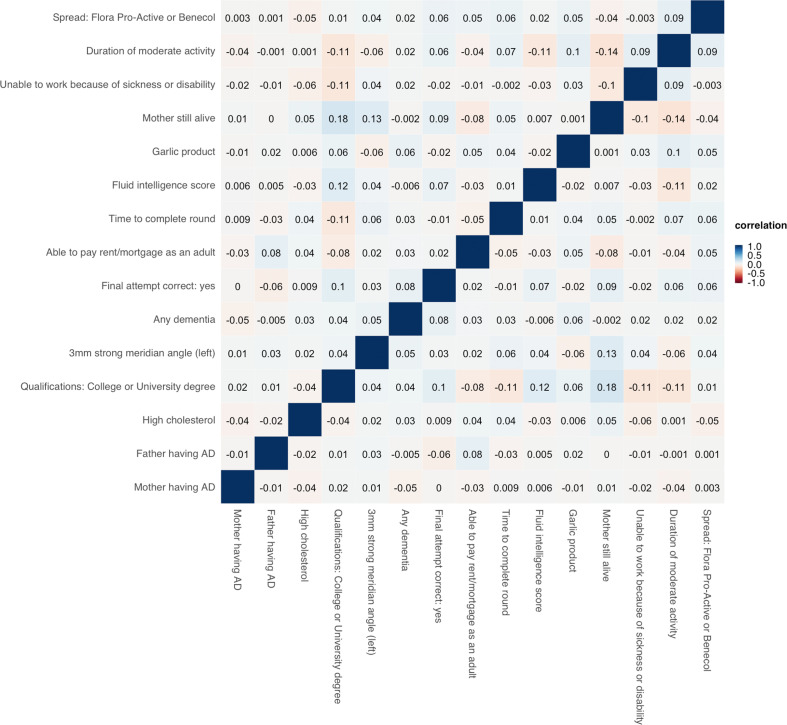
Figure 4. Polygenic risk score (PRS) correlation matrix for the 48 traits identified in marginal association analysis.
Trait categories and association directions with Alzheimer’s disease (AD) are annotated. The dendrogram indicates the results of hierarchical clustering. We used 1000 genome samples with European ancestry to calculate PRS and evaluate their correlations. Label ‘irnt’ means that trait values were standardized using rank-based inverse normal transformation in the genome-wide association study (GWAS) analysis.


