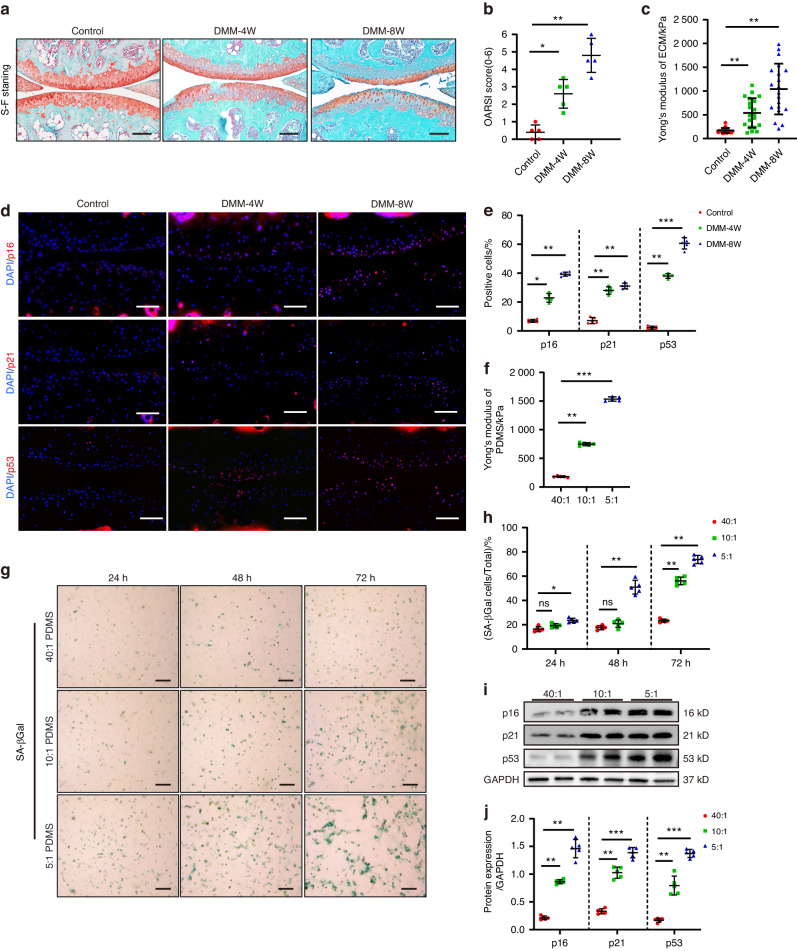
Fig. 1.
ECM stiffening induced chondrocyte senescence in vitro and in mice. a Representative images of safranin O/fast green staining of controls and mice at 4 and 8 weeks after DMM surgery. Scale bars: 100 µm. b Quantitative analysis of the OARSI scale (n = 5). c Measurement of matrix stiffness (Young’s modulus) for controls and mice at 4 and 8 weeks after DMM surgery using atomic force microscopy (AFM) (n = 20). d Representative images of immunofluorescence of p16INK4a, p21, p53 in chondrocytes of controls and mice at 4 and 8 weeks after DMM surgery. Scale bars: 50 µm. e Quantification of p16 INK4a, p21, p53-positive chondrocytes as a proportion of the total chondrocytes of control and DMM mice (n = 5). Data are shown as mean ± SD. f Measurement of matrix stiffness (Young’s modulus) for 40:1, 10:1 and 5:1 PDMS using atomic force microscopy (AFM) (n = 5). g, h Representative images and quantification of SA-βGal staining in primary chondrocytes cultivated on PDMS substrates of different stiffness (40:1,10:1, 5:1) for 24, 48, and 72 h (n = 5). Scale bar: 50 µm. i, j Western Blotting analysis of p16INK4a, p21 and p53 expression in mouse primary chondrocytes cultivated on 40:1,10:1, 5:1PDMS for 48 h (n = 5). *P < 0.05, **P < 0.01, ***P < 0.001. ns not significant; Con control, DMM destablization of the medial meniscus, DAPI 4’,6-diamidino-2-phenylindole, OARSI Osteoarthritis Research Society International, 40:1, 10:1, 5:1, 40:1, 10:1, 5:1 polydimethylsiloxane (PDMS) substrates

