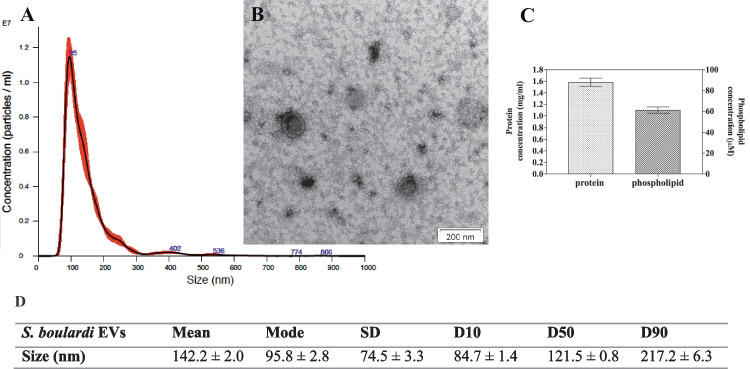
Fig. 1.
Characteristics of S. boulardii EVs. NTA particle size distribution analysis (A) and TEM image of EVs (B); representative histograms of the average size distribution from three measurements of a single sample (black line). The numbers show the maxima of particular peeks, and widened areas indicate the standard deviation (SD) between measurements. Average protein and phospholipid content in S. boulardii EVs (C). The size parameters of the EVs measured by NTA; factors D10, D50, and D90 mean that 10%, 50%, and 90% of the EV population had a diameter of less than or equal to the given value (D)

