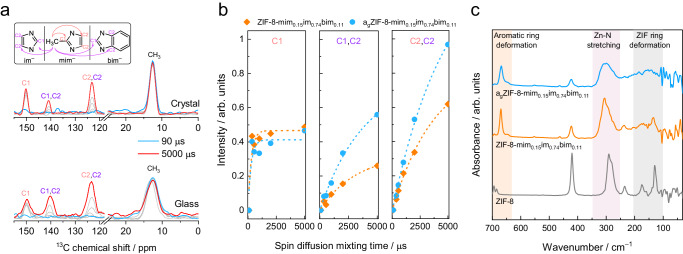
Fig. 4. MAS NMR and far-IR spectroscopic characterization.
a Slices along the indirectly detected dimension through the 2D 1H-13C spin-diffusion solid state NMR spectra of crystalline ZIF-8-mim0.15im0.74bim0.11 (top) and glassy agZIF-8-mim0.15im0.74bim0.11 (bottom). Slices were taken at a 1H chemical shift of 1.5 ppm and normalized to the peak area of –CH3. The slices show the polarization transfer from the protons of the –CH3 groups of mim– to all 13C atoms in the samples as a function of the mixing time. Blue lines represent the slices obtained with a spin-diffusion mixing time of 90 µs, red lines correspond to a mixing time of 5000 µs, and gradually increasing grey lines correspond to mixing times of 360, 540, 1000 and 2000 µs. b Comparison of the spin-diffusion polarization transfer processes in the crystalline and glassy states. Peach-colored labels in a and b represent intramolecular polarization transfers within mim–, while purple labels represent inter-linker polarization transfers from mim– to im– or bim–. Dashed lines are exponential fits to the data. c Far-IR spectra of ZIF-8, ZIF-8-mim0.15im0.74bim0.11 and agZIF-8-mim0.15im0.74bim0.11.

