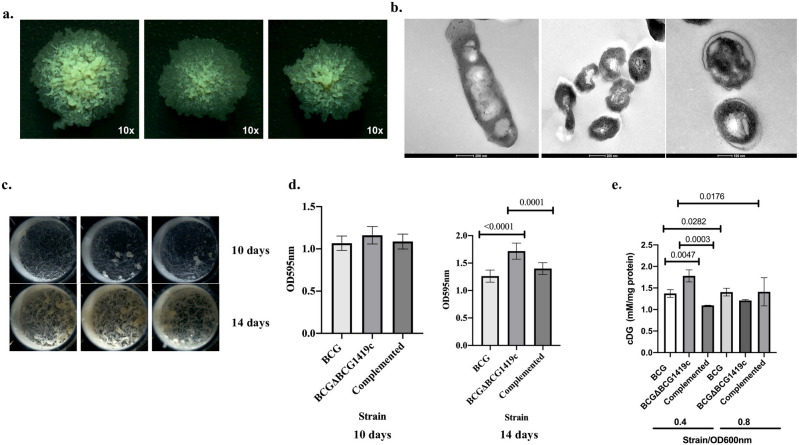
Figure 1.
Phenotypic changes in colonial and ultrastructural morphology, biofilm and c-di-GMP production in the presence or absence of BCG1419c. (a) Isolated, single colonies obtained after 3 weeks of incubation at 37 °C on 7H10 OADC agar plates. (b) TEM of BCG and BCGΔBCG1419c planktonic cells cultured in 7H9 OADC Tween 80 and harvested at OD600nm 0.8. Representative electron microscopy micrographs of parental BCG and mutant BCGΔBCG1419c. (Left panel) typical morphology of the BCG strain. (Middle panel) abnormal morphology of BCGΔBCG1419c showing smaller bacilli with irregular shape, some cells show constrictions or cavities on the bacterial surface (arrows). (Right panel) high power magnification of mutant bacilli showing widened electron-lucid cell wall (arrows). (c) Surface pellicles formed in Sauton media with no detergent at 37 °C, 5% CO2, for 10 (top panel) or 14 days (bottom panel) in tissue culture flasks with vented caps. (d) Biofilm quantification of the different BCG strains at 10 days or 14 days of culture in Sauton media, in 48-well plates. For colonies, images at ×10 are shown. All experiments were performed three different times, with duplicates (c,d), and one representative image is shown in all instances; error bars represent standard deviations of the. One-Way ANOVA followed by Dunnett’s multiple comparison test was used to assess significance of changes among BCG strains. Statistically significant p actual values are shown on top of the bars depicting the means. (e) c-di-GMP content (mM) was normalized to mg of protein per sample and was determined by HPLC for in vitro cultures of BCG, BCGΔBCG1419c, and its complemented strain, at OD600 nm 0.4 and 0.8 (triplicate cultures). Data are shown as means with bars indicating standard deviation (SD). OD600nm refers to the optical density at 600 nm at which samples were harvested. Statistically significant differences are indicated by the p values shown.

