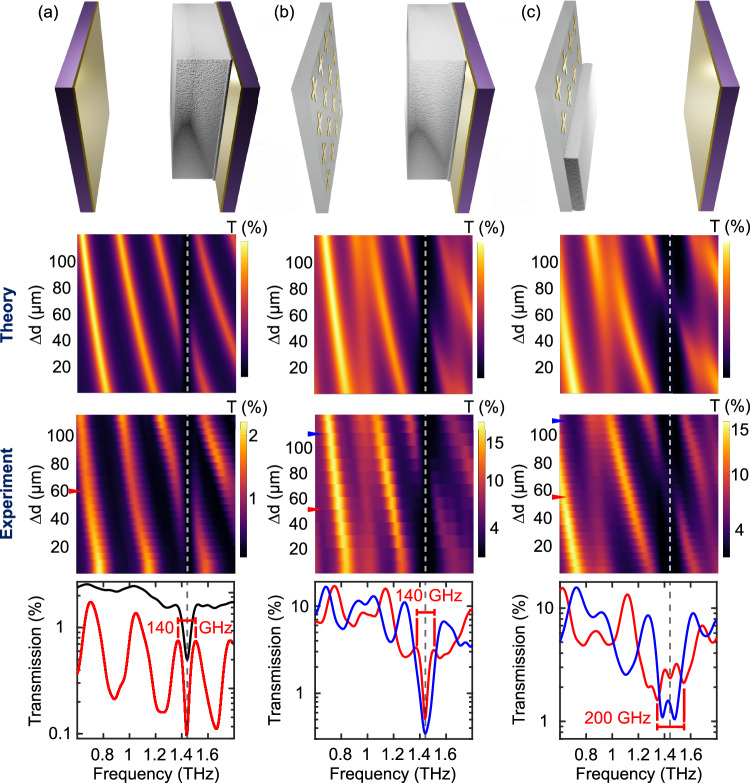
Fig. 4. Strong light–matter coupling with FP and hybrid cavity architectures.
Transmission spectra for a standard FP cavity, b H1 and c H2. Top to bottom row shows the schematics of the cavity architectures, the 2D transmission map calculated with the transfer matrix approach as a function of relative cavity spacing and frequency, the experimentally acquired transmission maps of the cavities, and cross sections through the transmission profile of the experimental results. In the plots at the bottom, the black curve in a shows the transmission of a glucose-coated gold mirror, while the red and blue curves show the transmission for different cavity lengths (on-resonance/off-resonance), as indicated by the arrows in the transmission map above. The H2 architecture leads to an enhanced polaritonic response, showing a substantially broader Rabi splitting when a cavity mode is overlapping with the polaritons of the coupled MS.

