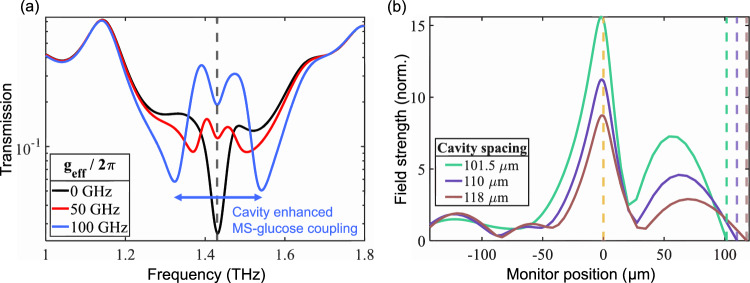
Fig. 5. Transfer matrix and FDTD simulations of the hybrid cavity.
a Transfer matrix simulation of cavity transmission (on-resonance) for different glucose–MS coupling strengths geff and dgl = 100 μm. The arrows indicate the enhanced Rabi splitting of the MS–glucose interaction due to the cavity configuration. The vertical dashed line shows the location of the glucose resonance. When geff > 0, the glucose–MS polaritons are dominant, and the transmission result resembles experimental observations of the H2 configuration. Otherwise, when geff = 0, only the cavity–glucose interaction remains, and the transmission result resembles the H1 configuration. b A FDTD investigation of an empty hybrid cavity. The position of the mirror, relative to the array interface (0 μm, orange dashed line), determines the cavity spacing and, thus, the cavity resonance. Reducing the cavity spacing (from brown to purple to green) allows one to bring the cavity mode in resonance with the MS mode. The electric field magnitude within (>0 μm) and outside (<0 μm) of the cavity is monitored in one dimension and normalized to the incident field. The green curve shows the field profile obtained when the plasmonic and cavity modes are resonant with each other. The corresponding vertical dashed lines show the positions of the mirror. The enhancement of the field amplitude is consistent with the modified Rabi splitting showcased in (a).

