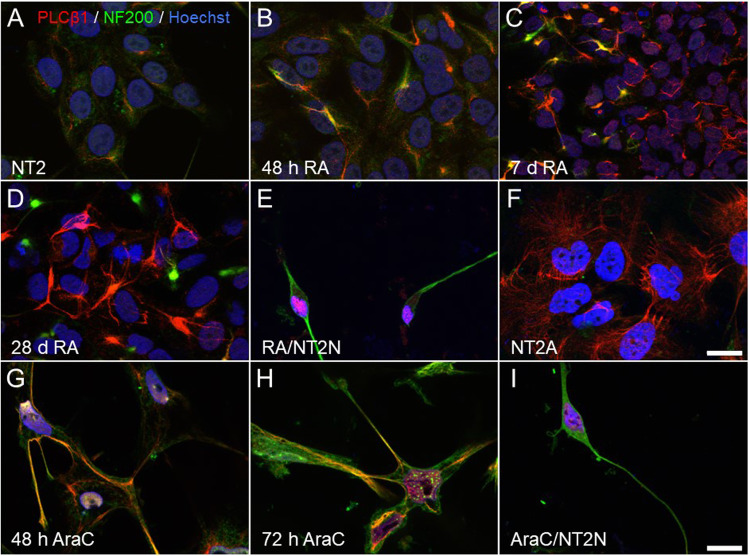
Fig. 2. Visualization of PLCβ1 and NF200 during RA and AraC differentiation of NT2 cells.
Immunofluorescence images using anti-PLCβ1 (red), NF200 (green) and Hoechst’s chromatin staining (blue) of NT2 progenitors (A) and after treatment with RA (A–F) or AraC (G–I). Cells treated with RA were fixed and immunostained at 48 h (B), 7 days (C), 28 days (D), and after isolation of terminally differentiated NT2N neurons by mechanical dislodging (E). Non-neuronal cells (NT2A) that remained attached to the culture flask after the mechanical isolation of NT2N neurons were also doubly immunostained for PLCβ1 and NF200 (F). Cells treated with AraC were fixed at 48 h (G), 72 h (H) and 6 days, when cells were differentiated into NT2N neurons (I). Images are maximum intensity projections of four consecutive optical sections separated by 0.24 µm and obtained using a structured illumination module. Scale bar in F = 20 µm (applies to A–F). Scale bar in I = 20 µm (applies to G–I).

