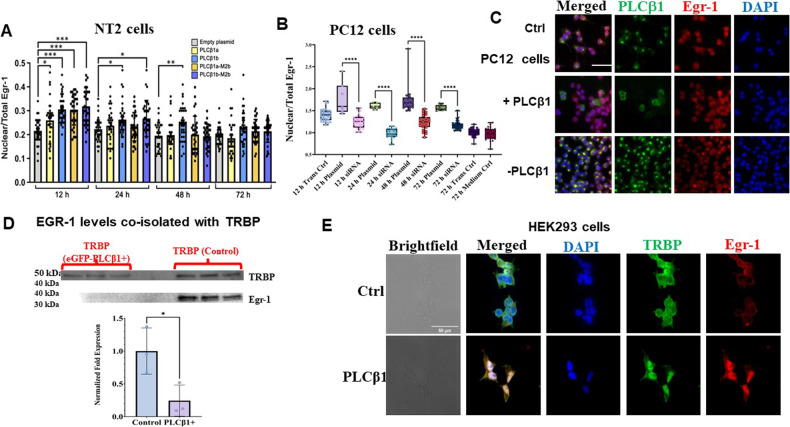
Fig. 5. Over-expression of PLCb1 in undifferentiated NT2 and PC12 cells increases nuclear localization of Egr-1.
A Changes in the nuclear versus total cell intensity of Egr-1 after transfection of NT2 cells with empty plasmid or different PLCβ1 constructs. Data are mean ± SEM (n = 33). Statistical significance was assessed by one-way ANOVA followed by post hoc Tukey’s test (*p < 0.05; **p < 0.01; ***p < 0.001). B–C Box plots and representative immunofluorescence images showing Egr-1 nuclear levels in PC12 cells exposed to different treatments, including transfection medium alone, complete medium alone and transfection medium combined with complete medium. Plots show min to max vaules as well as individual data points. Significance was assessed by unpaired t test: ns (P > 0.05), * (P ≤ 0.05), ** (P ≤ 0.01), *** (P ≤ 0.001), and **** (P ≤ 0.0001). Scale bar in C = 50 µm. D Data showing that upregulation of PLCβ1 in PC12 cells causes the dissociation between TRBP and Egr-1 where TRBP was immunoprecipitated from PC12 cell lysates and Egr-1 levels were quantified by Western blotting. Bar graph shows mean values ± SD as well as individual data points. Unpaired t test was used to assess statistical significance (*p < 0.05, **p < 0.01, ***p < 0.001, ****p < 0.0001). E Immunofluorescence images probing changes in TRBP and Egr-1 in control HEK293 cells and cells induced to over-express PLCβ1. Scale bar in E = 50 µm.

