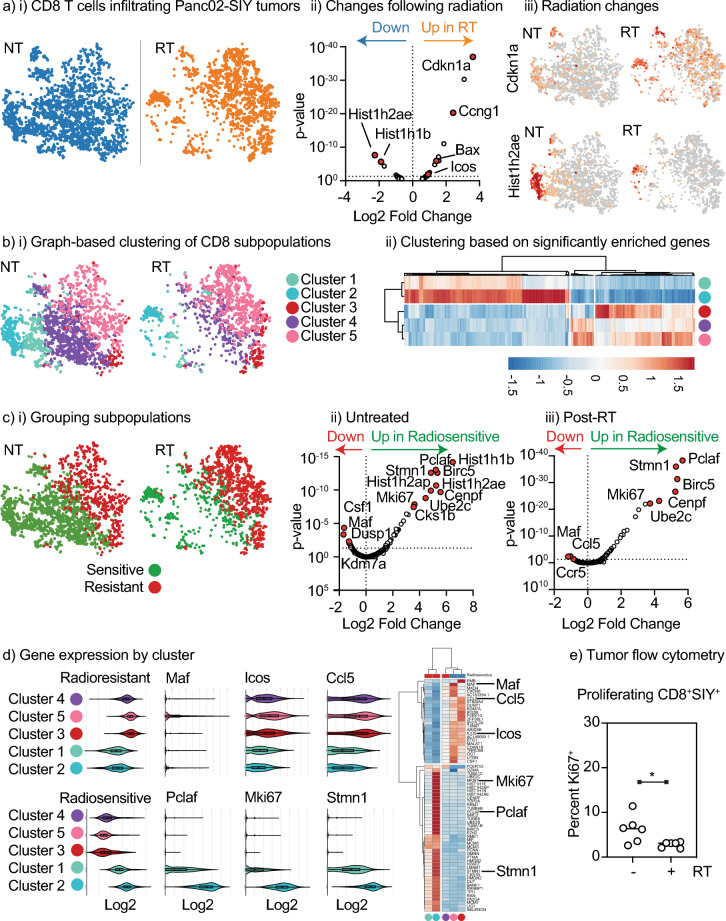
Figure 4.
Radiation selectively eliminates proliferating CD8 T cells in the tumor resulting in an enrichment for exhausted CD8 T cells. scRNASeq of CD45+ cells infiltrating Panc02-SIY tumors left untreated or treated 1 day prior with 12 Gy RT was subgated for cells expressing Cd3e and Cd8a and reclustered. (a) (i) t-SNE plot shows CD8 T cells in untreated (NT) versus irradiated (RT) tumors. (ii) Volcano plot showing differential gene expression between NT and RT tumors, with key genes marked. (iii) Expression of Cdkn1a and Hist1h2ae in CD8 T cells. (b) (i) Distinct clusters from graph based clustering of CD45+ cells that are within the CD8 T cell population. (ii) Cluster plot showing differentially expressed genes that are locally different between the populations. (c) (i) Recategorizing clusters as radiosensitive or radioresistant Volcano plots showing differentially expressed genes between radiosensitive and radioresistant CD8 T cells in (ii) untreated and (iii) irradiated tumors. Key genes are marked. (d) Expression of a panel of genes enriched in radioresistant versus radiosensitive CD8 T cells, as a violin plot and as a cluster plot, with individual examples of each highlighted. (e) Panc02-SIY tumors were left untreated or treated with 12 Gy RT and harvested 24 h later. Tumors were analyzed by flow cytometry for Ki67 expression in CD8+ SIY-specific T cells. Key. *p < 0.05.

