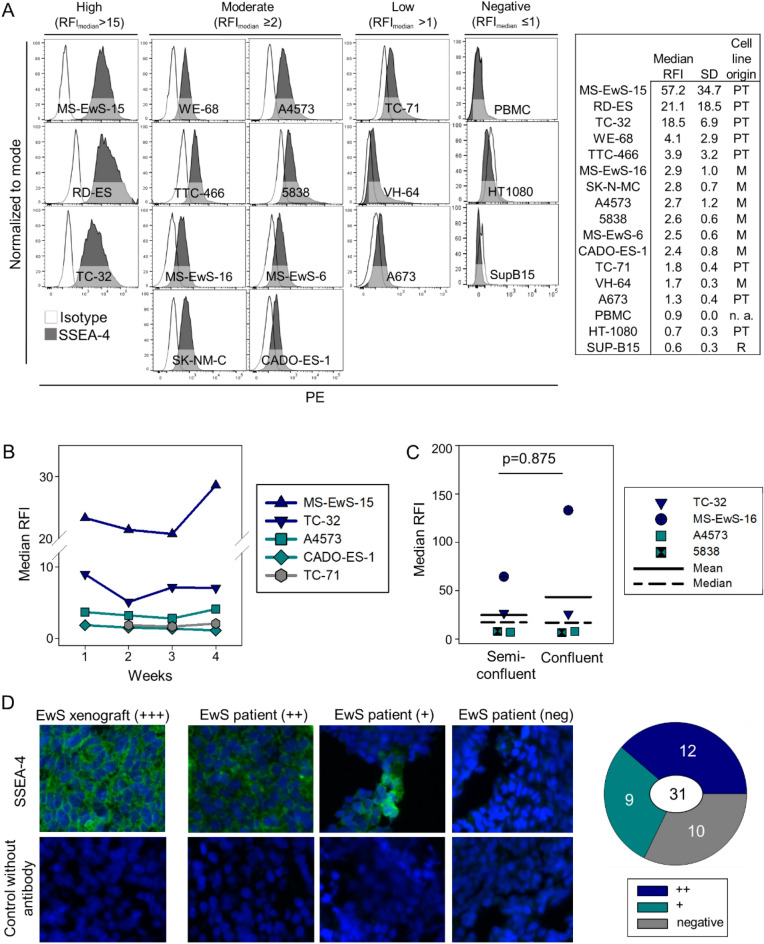
Figure 1.
SSEA-4 expression in EwS. (A) SSEA-4 surface expression by flow cytometry in 14 EwS cell lines, derived from primary tumors (PT) or metastatic relapse samples (M), as indicated. Median relative fluorescence intensities (RFI) were determined in 2 to 4 individual experiments per cell line and used to calculate the mean and standard deviation (SD) of SSEA-4 expression per cell line as shown in the table. Cell lines were categorized by median RFI as SSEA-4 high (RFI ≥ 15), SSEA-4 moderate (RFI ≥ 2 and < 15) or SSEA-4 low (RFI > 1 and < 2). PBMC from healthy donors and cell lines from a B lineage leukemia (SUP-B15 and a fibrosarcoma (HT-1080) were stained as controls. Representative experiments with PBMC from 2 donors and 4 replicates for the cell lines are shown. (B) Stability of SSEA-4 expression during 4 weeks of continuous cell culture of 5 individual cell lines expressing SSEA-4 at high (MS-EwS-15, TC-32), moderate (A4573, Cado-ES-1) or low (TC-71) densities. Differences in SSEA-4 expression over time was analyzed with the one-way repeated measurements ANOVA (p = 0.255). (C) SSEA-4 expression in 4 EwS cell lines (MS-EwS-16, TC-32, A4573 and 5838) at cell confluencies of 50–70% (semiconfluent) versus 80–100% (confluent). Differences were analyzed with the Wilcoxon signed rank test. (D) Immunofluorescence analysis of SSEA-4 expression in tumor tissues, including a TC-32 murine xenograft tumor and tumor tissues from 31 EwS patients with either primary or relapsed disease, stained with MC 813-70 antibody or without primary antibody as control. Shown are representative examples of tumors with high (++), moderate/heterogeneous (+) and negative SSEA-4 expression. Details regarding the individual patients are found in Supplementary Table 2.

