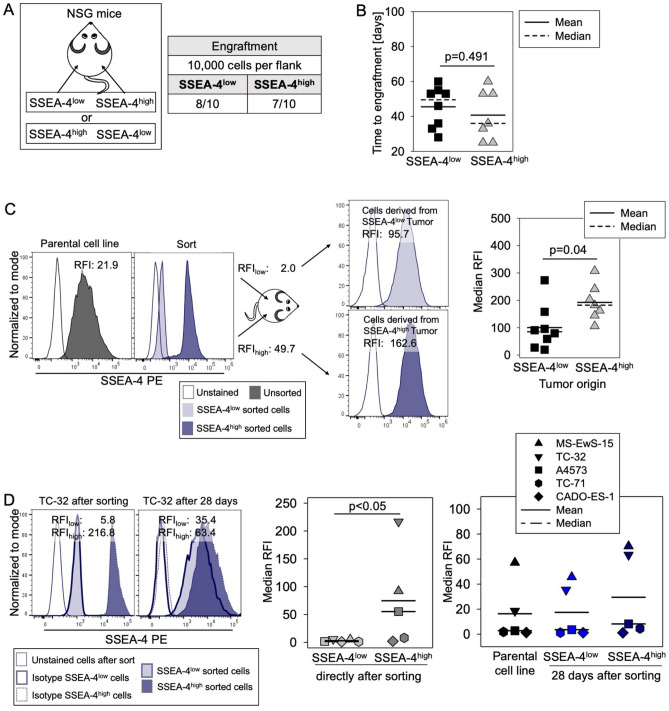
Figure 4.
SSEA-4 expression increases during in vivo tumor growth, and SSEA-4low EwS cells regain SSEA-4high expression in vivo and in vitro. (A) Engraftment of TC-32 cells in NSG mice after subcutaneous injection of 10,000 SSEA-4low versus 10,000 SSEA-4high TC-32 cells each directly after cell sorting into the left and right flanks of 10 NSG mice, respectively. (B) Time to engraftment was assessed via palpation twice per week. The student´s t-test was used to analyze differences. (C) SSEA-4 surface expression by flow cytometry on tumor cells from dissociated tumor xenografts derived from either SSEA-4low and SSEA-4high subpopulations. The left panel shows one representative example of SSEA-4high and SSEA-4low cell populations derived from the xenografts compared to SSEA-4 expression after cell sorting directly prior to injection into mice and the parental cell line. The right panel shows the median RFI from all engrafted tumors.The student´s t-test was used to analyze differences. (D) SSEA-4 expression levels during 28-day in vitro culture of sorted SSEA-4low and SSEA-4high subpopulations from five EwS cell lines analyzed by flow cytometry. Shown are the SSEA-4 expression quantified by median RFI of the parental cell lines, directly after sorting and on cells from SSEA-4low and SSEA-4high subpopulations after 28 days of continued cell culture. Statistical significance was determined with the Friedman Repeated Measures Analysis of Variance on Ranks (p = 0.003) and subsequent significances were determined with the Tukey Test. Only significant differences are annotated.

