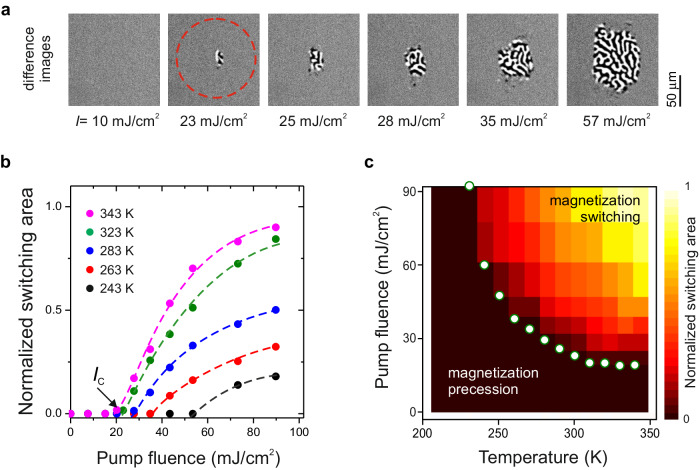
Fig. 3. Dissipation during all-optical toggle switching.
a The switching pattern measured at various fluences at room temperature. b Normalized switched area as function of fluence at different temperatures. c Diagram representing the switching efficiency of cold photo-magnetic recording. The color code represents the normalized switching area. The dark color corresponds to intensities insufficient for switching. The white dots highlight the minimum fluence IC required for detectable switching.

