
Figure 2.
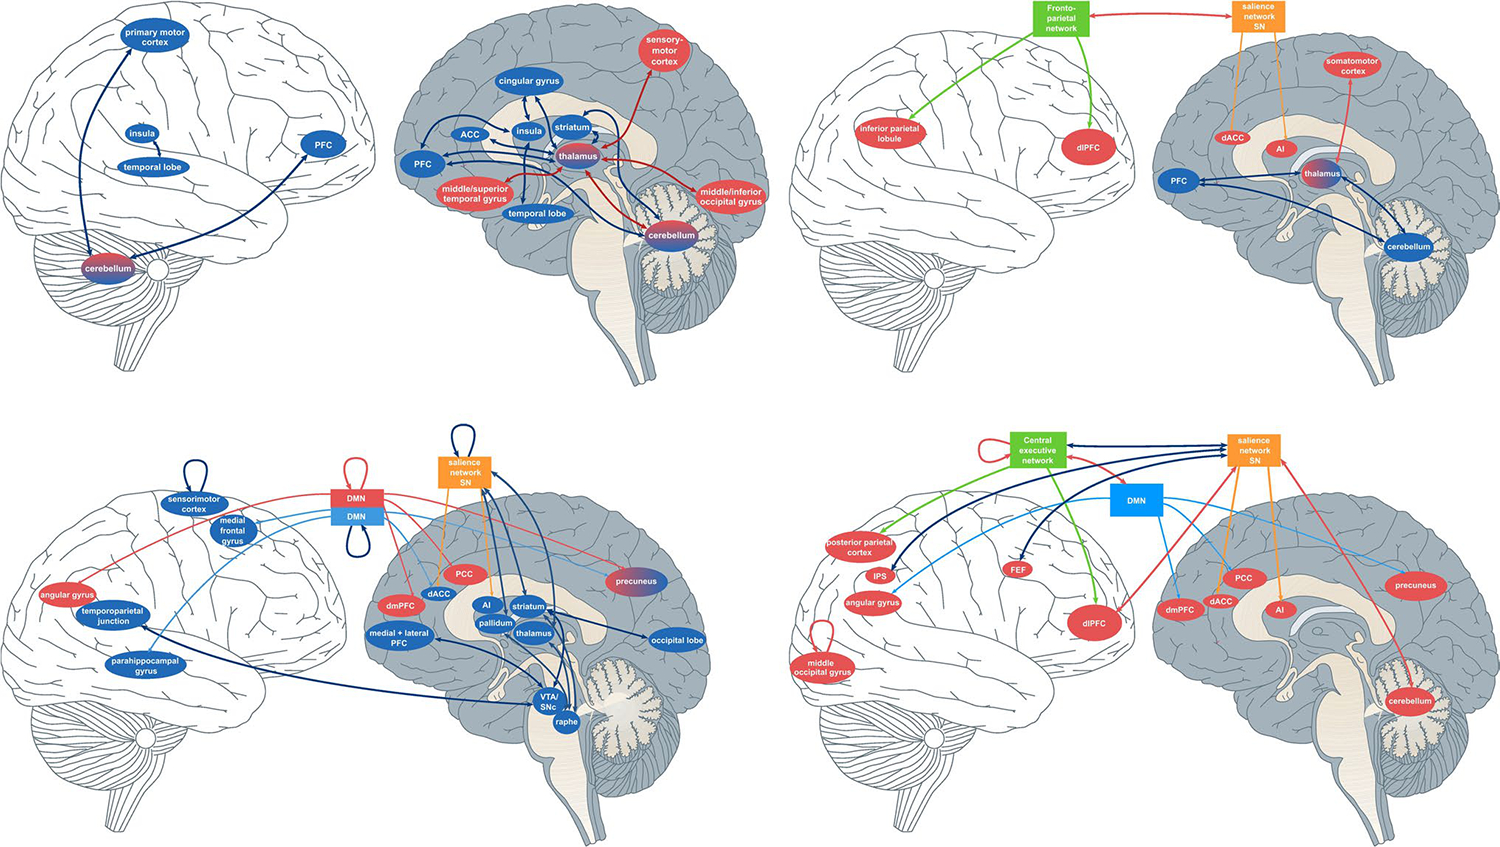
A graphical summary demonstrating the interplay of the different brain regions and networks associated with FC connections in patients with schizophrenia. Blue arrows indicate decreased functional relationships in schizophrenia vs. healthy controls; red arrows indicate functional relationships that increase in patients vs. healthy controls. In summary, a complex “highway” of brain regions such as various sensorimotor, thalamic, and prefrontal areas that moderate behavioral and cognitive symptoms seen in schizophrenia. From L-R: 1.) Left top: a graphical summary of the cerebello-thalamo-cortical and subcortical dysconnectivity. 2.) Right top: Neurodevelopmental model 3.) Bottom left: Neurotransmitter model. Bottom right: 4.) Triple Network dysconnectivity represented graphically.