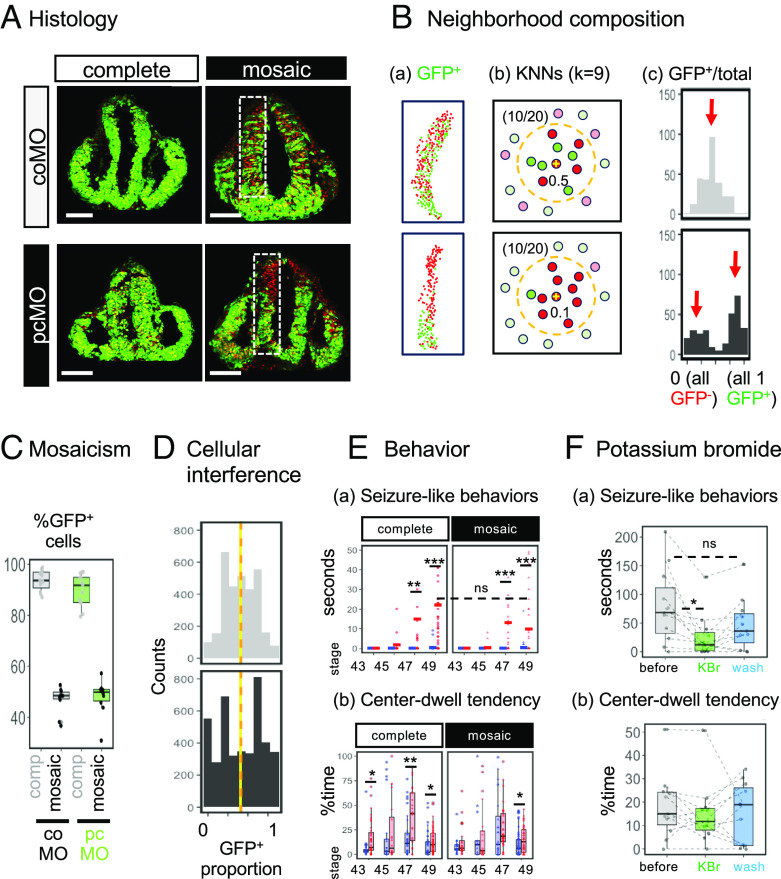
Fig. 2.
Histological and behavioral outcomes of mosaic versus complete knockdown. (A) Representative images of GFP+ (MO-containing) cells in the developing neuroepithelium (stage 27). Nuclei are counterstained in red. (Scale bars, 100 µm.) (B) Assessing the distribution of GFP+ cells. (a) Cell counting. (b) K-nearest neighbors (KNNs). For each cell, a 10-cell neighborhood (k = 9, orange dashed circle) is defined and the GFP+ proportion is calculated. In this example, 50% are GFP+ in both conditions (i.e., 10/20), but the coMO and pcMO cells receive 0.5 and 0.1, respectively. (c) The distribution of neighborhood compositions. (C) Proportion of GFP+ cells per brain. (D) Distribution of GFP+ cells in all analyzed animals. The y axis represents the number of counted cells. P < 2.2 × 10⁻¹⁶ (D = 0.1408) in the asymptotic Kolmogorov–Smirnov test. Vertical lines represent means: coMO = 0.486 (yellow) and pcMO = 0.494 (orange), P = 0.29 in the unpaired t test. (E, a) Seizure-like behaviors (solid lines represent means) and (b) center-dwelling time of coMO (blue) and pcMO (red) tadpoles over time. Each point represents an observation (see SI Appendix, Extended Materials and Methods for the numbers of analyzed animals). *P < 0.05, **P < 0.01, ***P < 0.001, and ns, not significant; post hoc Tukey test following two-way ANOVA. (F) Effect of potassium bromide at stage 49. (a) Seizure-like behaviors. (b) Center-dwell tendency. *P < 0.05 and ns, not significant; repeated-measure ANOVA followed by post hoc Bonferroni tests (n = 11).

