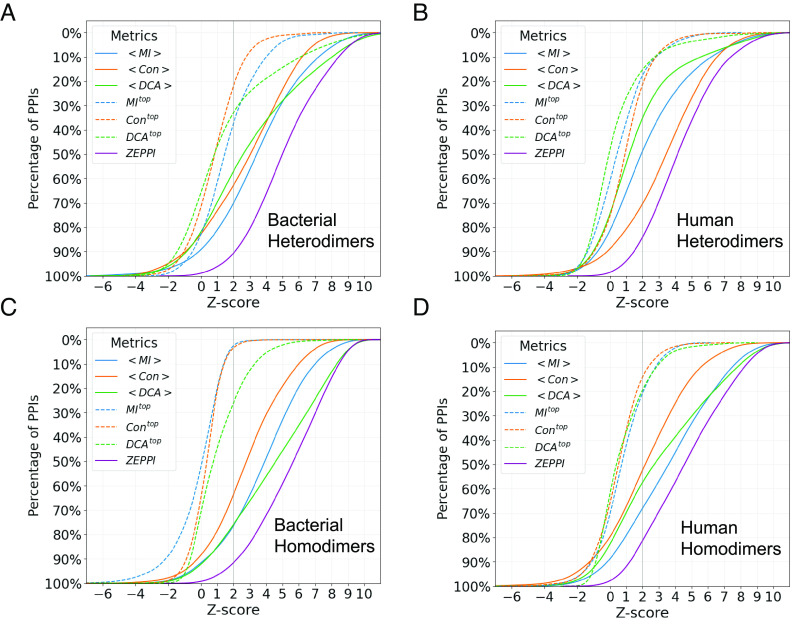
Fig. 2.
Percentage of PDB PPIs as a function of Z-score is shown for bacterial heterodimers (A), human heterodimers (B), bacterial homodimers (C), and human homodimers (D). Colors and line types in the legend indicate curves for different metrics each of which corresponds to the maximum of the raw and APC values for a given PPI. The mean and top metric of all interface contacts are denoted as <>, and top, respectively. The ZEPPI score for a given PPI is the largest Z-score among all metrics (purple). See SI Appendix for details.

