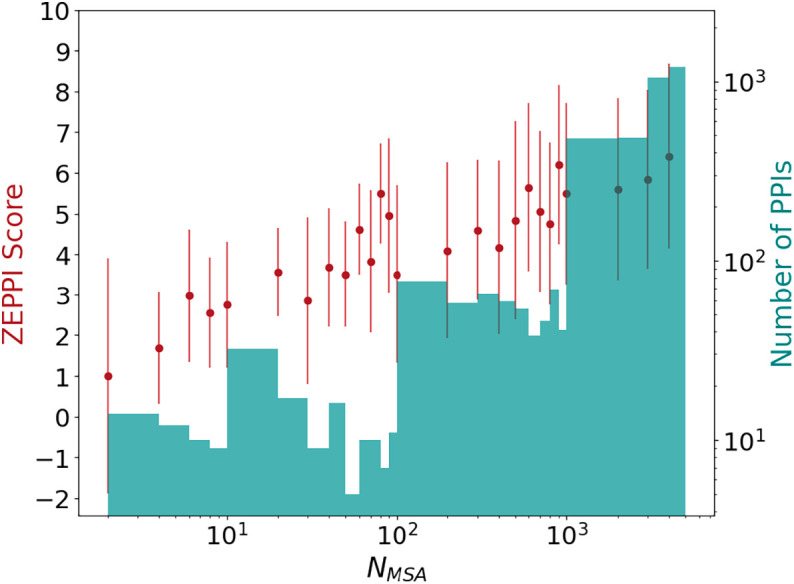
Fig. 3.

Effect of MSA depth on ZEPPI score for PDB dimers. The ZEPPI score is plotted against pMSA depth, NMSA, where each red dot and error bar correspond to the average and SD of the ZEPPI score for the PPIs in a given bin of NMSA values. A histogram of the numbers of PPIs in each bin is shown in green. Data are plotted on a log scale for NMSA and the number of PPIs. NMSA is the depth of the paired MSAs after checking the coverage of surface residues (Methods).
