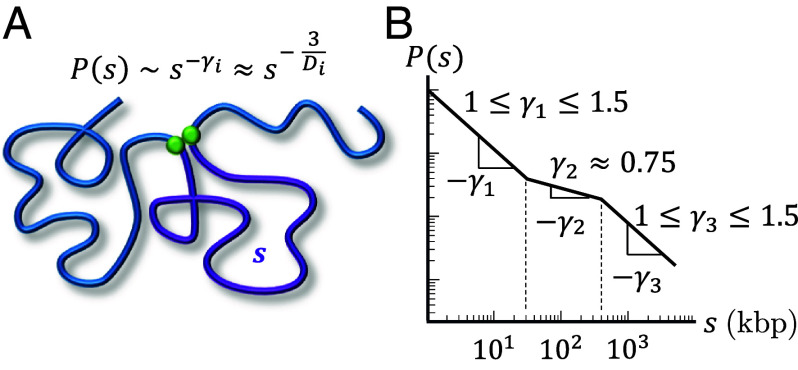
Fig. 2.
Contact probabilities in interphase chromatin. (A) Schematic of a contact between two loci (green circles) separated by genomic distance (purple curve). The contact probability between the two green loci is proportional to a power law where the subscript i indicates a specific regime. within a mean-field approximation, where is the fractal dimension. (B) Schematic plot of the average contact probability for chromatin as a function of genomic separation with three scaling regimes on a log–log scale.

