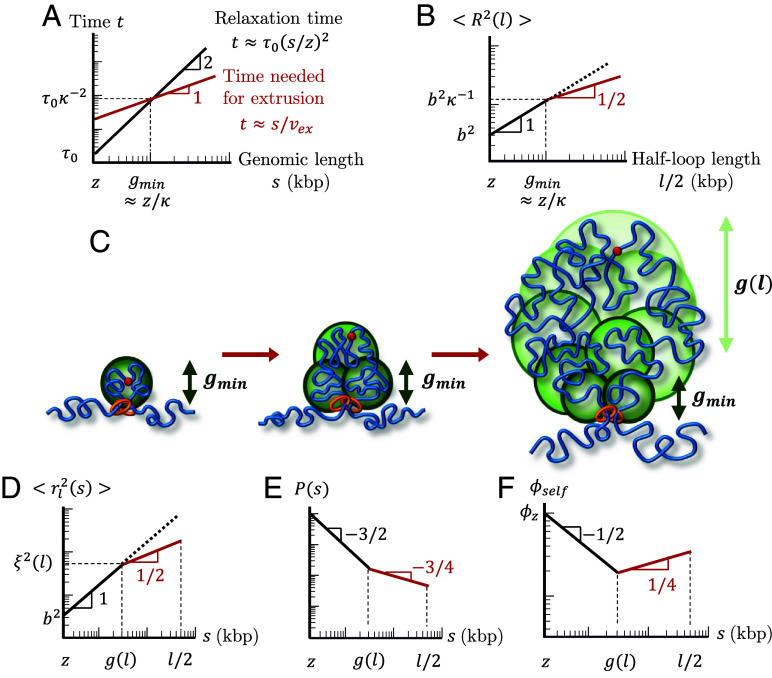
Fig. 5.
Structure of an actively extruded loop. All schematic plots are on log–log scales. (A) Schematic plot comparing the relaxation time (black) and time needed for a single cohesin domain to extrude a chromatin section with genomic length s (red). (B) Schematic plot of the mean square size of a loop with genomic length l. The red line segment indicates the regime consistent with . The dotted line shows the mean square size of a chromatin section with genomic length without extrusion. (C) Relaxed sections (green circles) in a growing loop overlap in space forming a fractal with dimensionality . The smallest relaxed section has the genomic length . The genomic length of each relaxed section (green circles) grows from next to the cohesin to next to the cohesin binding site (red circle). (D) Mean square distance between two loci separated by a genomic distance within a loop of genomic length (Eq. 8). The average is taken over all loci pairs within the loop extruded by the same cohesin domain. The red line segment indicates the regime consistent with . The dotted line shows the mean square distance without extrusion. (E) Average contact probability between loci separated by genomic length s within an extruded loop of length . The red line segment indicates the regime consistent with . (F) Volume fraction of a chromatin section of length within its own pervaded volume where the section is part of a loop with length . The red line segment indicates the regime consistent with .

